A California surprise, Part I

Something unexpected happened when California ordered its utilities to save water: the state’s investor-owned private utilities out-conserved local governments.
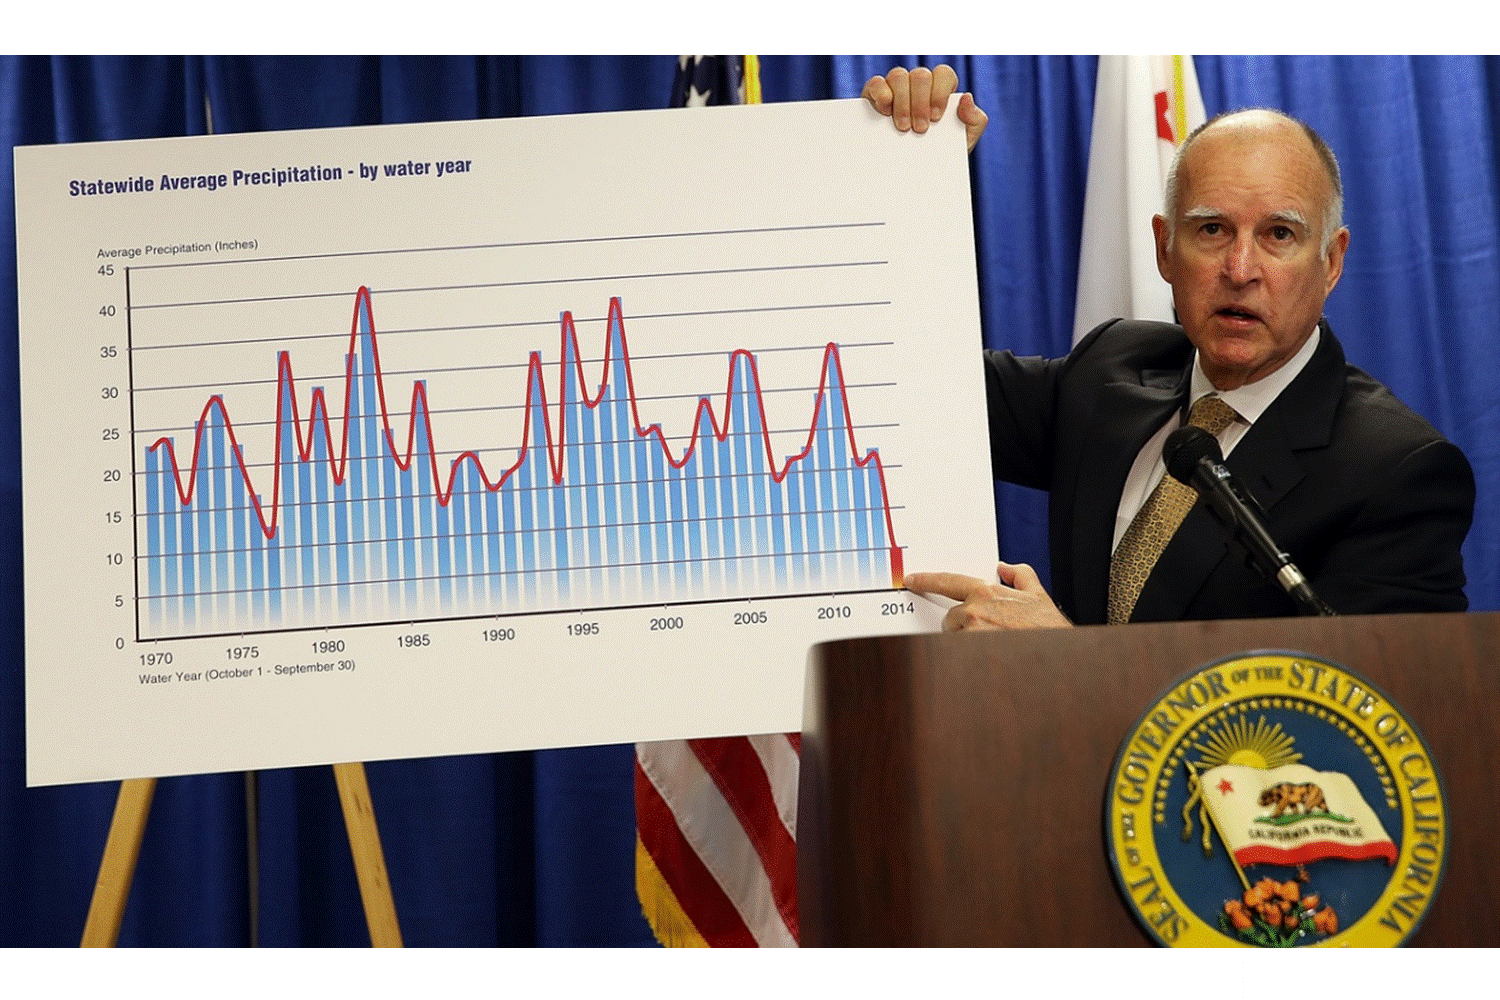
California’s long-term drought began as early as 2007, but intensified to crisis conditions by 2012. Conditions worsened, and in response 2015 Governor Jerry Brown and the California State Water Resources Control Board imposed restrictions on 408 drinking water utilities designed to reduce urban water usage by 25% statewide. The order required utilities to cut water use, but left individual utilities to choose the means by which to achieve conservation. The mandate assigned each utility its own conservation target, with standards ranging from 4-36% reductions relative to 2013 levels. These standards were formulaic, and varied based on utilities’ historical water consumption.
These conservation rules were in place for twelve months—June 2015 through May 2016—and applied to both local government utilities and private, investor-owned utilities. Conservation rules were assigned based on historical demand patterns and supply considerations only, not on ownership or governance.
Happily, the State of California has shared utility-level conservation data lavishly—a boon to water policy researchers! Over the past year, I’ve been sifting through that mountain of data with Youlang Zhang and David Switzer to see how California’s conservation efforts have fared. We’re discovering some fascinating things. The first of our studies is now forthcoming in Policy Studies Journal.
Restricting the flow
Faced with water scarcity, communities frequently restrict residential outdoor water use, such as car washing and especially lawn/garden irrigation. These water restrictions are effective in driving immediate reductions in water consumption. In California those restrictions typically take the form of limiting the number of days when outdoor irrigation is allowed each week. The graph below shows how public and private utilities regulated outdoor irrigation during the drought.

Eyeballing that graph, there doesn’t appear to be much difference between public and private utilities. But after adjusting statistically for a host of factors like utility size, demographic composition, and hydrological conditions, it turns out that private, profit-seeking, investor-owned utilities restricted irrigation about 4% more than public, local government utilities. That may not seem like much, as we’ll see it’s actually huge.
Meeting the mandate
We were also interested in what made utilities more or less likely to comply with the state’s conservation rules. Overall compliance was about 53%–that is, on average 53% of utilities reached their conservation targets each month. We modeled compliance statistically, and found a number of interesting correlates of success and failure. But most notable was a yawning gap between public and private sector: after adjusting for other factors, private utilities were nearly twice as likely as similar public utilities to meet the state’s conservation standards.
Conservation achievements
Finally, we analyzed overall conservation during the mandatory conservation period. And again, we found that, after accounting for other factors, private utilities conserved an average of 3% more water each month than their public counterparts during the mandatory restriction period. Although this difference is small in percentage terms, it reflects an enormous difference in absolute volume of water. This plot presents the distributions of conservation results from June 2015-May 2016 for local government utilities (green), and what it would have been if each utility had saved 3% more:
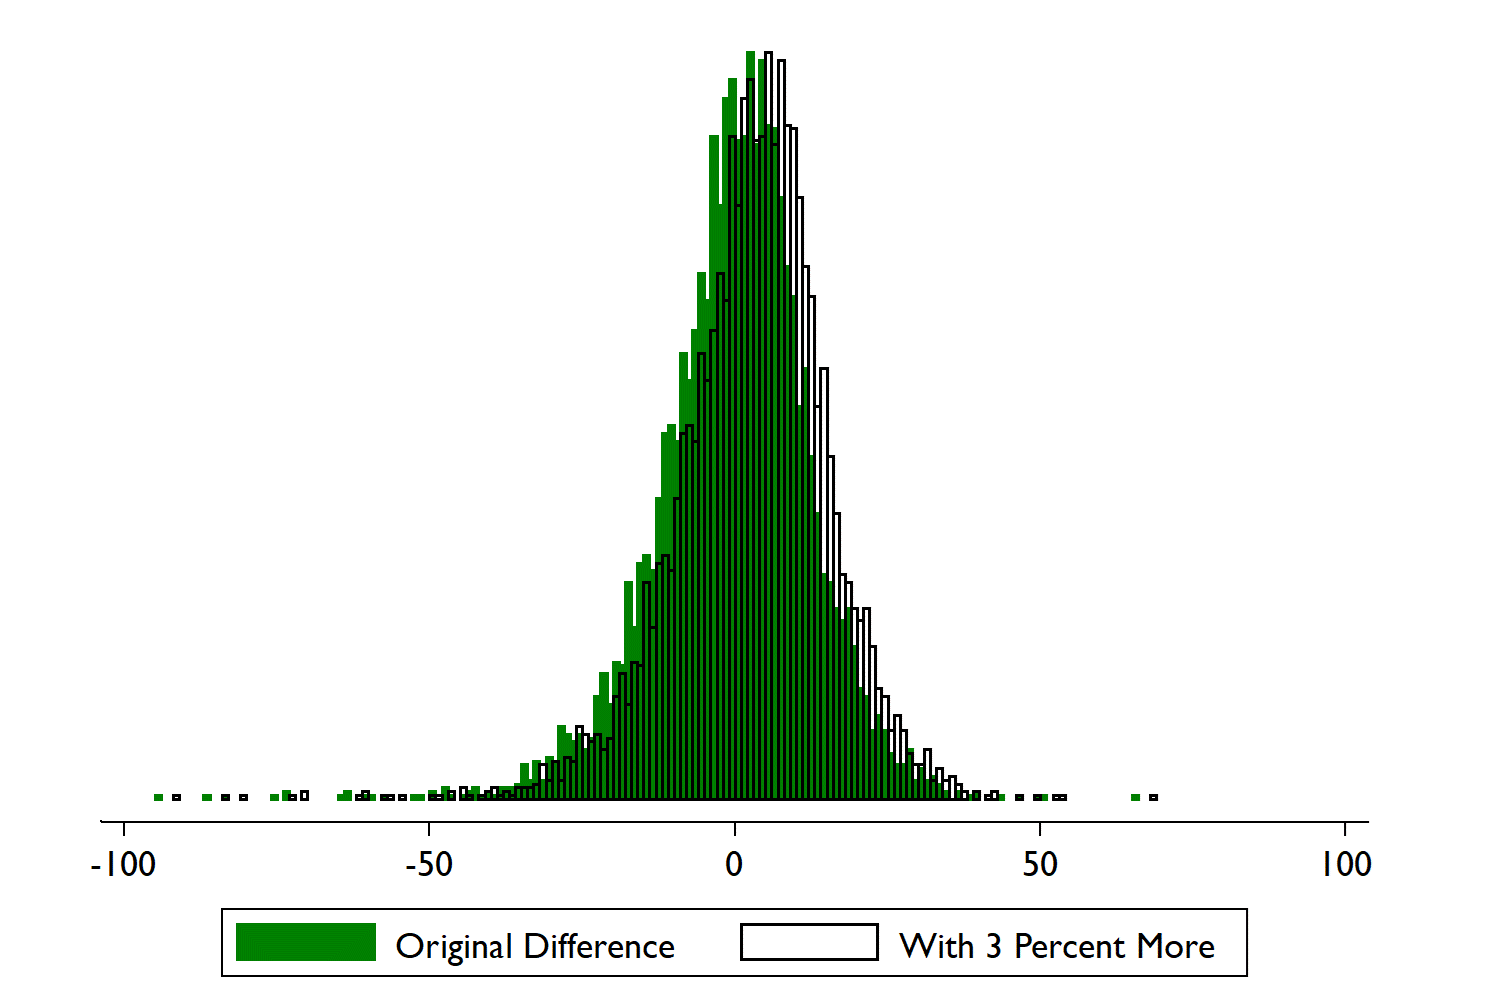
The areas within the white bars on the right side of the distribution represent the conservation that didn’t happen due to differences in ownership. Three percent greater conservation would have boosted public utilities’ restriction compliance rate from 51 to 62 percent.
In substantive terms, three percent greater conservation by California’s local government utilities during the mandate period would have reduced the state’s water consumption by 54.6 billion gallons—enough to supply the City of San Francisco for more than two years.

So what happened?
California is once again in the midst of a hot, dry summer; other parts of the world are, too. So it’s worth trying to figure out what’s behind the public-private disparity in drought response. Although it’s surprising at first blush, it’s actually a logical result of the institutions that govern water in America generally and California specifically. My next post will explain why.*
*Spoiler: as usual, it’s about money and politics. If you can’t wait for the next post, you can read the forthcoming article.