
Affordability in America, 2023 | Part 1

Prices at Der Rathskeller are up, too
It’s not your imagination—water and sewer service really are more expensive than they used to be. But figuring out how much more expensive can be surprisingly tricky.
A longstanding challenge for understanding utility affordability is that representative data on water and sewer prices didn’t exist until I published my first article depicting water/sewer affordability in the United States with data collected in 2017. Since then, I’ve updated and expanded that dataset biennially with the help of plucky and persistent research assistants at Texas A&M and UW-Madison.
With a fresh batch of data from 2023, we now have four biennial waves of nationally representative data*—which gives us enough to infer something about trends in the price and affordability of these essential services. This first in a series of three posts will start with the basics: how much residential water and sewer prices have changed over the past six years, where prices are highest and lowest, and how inflation in the water sector stacks up against inflation elsewhere in the economy.
The price of water & sewer service, 2023
In 2023 the average water utility in the United States charged $44.77 for one month of service for a residential customer who used 6,200 gallons of water; the average residential sewer service price for the same volume was $50.17.** Those prices continue a trend: over the past six years, prices have risen at an average annual rate of 3.8% for water and 3.2% for sewer. Today water is 25% more expensive and sewer 20% more expensive than they were in 2017.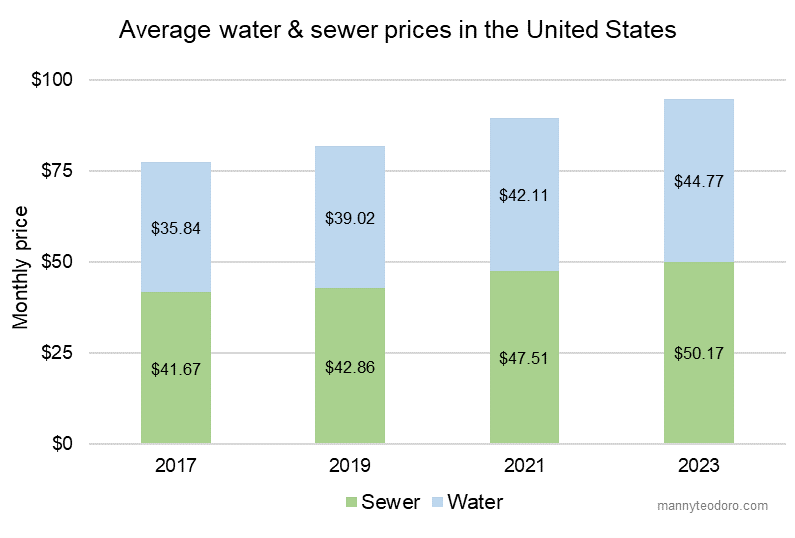
Average prices for one month of single-family residential service at 6,200 gallons per month.
Those are substantial increases, to be sure: water and sewer services take a bigger bite out of consumer wallets than they used to. But those increases aren’t out of line with other prices over the same period. Here’s annual water and sewer inflation compared with the Consumer Price Index (CPI), which is the government’s aggregate measure of consumer prices:

Water & sewer inflation imputed for even-numbered years. CPI data from BLS.
In fact, water and sewer service prices actually increased more slowly than the prices of some other consumer goods over this six-year period:

Historical electricity, milk, gasoline, and egg prices from BLS.
None of this is to suggest that water/sewer inflation aren’t significant, but rather to put it in context. As we’ll see in a future post, the confluence of rising water/sewer prices and surging consumer inflation are hitting low-income consumers hard. Overall consumer inflation surged in 2021 and 2022 but appears to be slowly declining toward its long-term average of 2-3%. Residential water and sewer prices seem likely to continue increasing apace at 3-4% annually.
Where water & sewer cost the most (and the least) in 2023
Eyeballing the data and a bit of statistical modeling reveal some interesting correlates of water and sewer prices; here I’ll highlight just a few. Most of what’s discussed below is about water, not sewer, because fewer notable patterns emerged from the sewer pricing data.
First, the average price of water correlates negatively with utility size, reflecting the oft-observed economies of scale that utilities enjoy:

Estimate based on regression model, controlling for ownership and water source. Thin bars represent 95% confidence intervals.
Interestingly, we don’t see the same relationship between size and sewer prices. The reasons for that disconnect aren’t clear; it might be due to the greater government subsidies that sewer systems have received historically, but that’s just a guess. [Edit: The lack of a relationship between size and sewer prices might also reflect technology. Many smaller sewer systems still use simple lagoons, rather than modern treatment plants. The lower costs of those lagoon systems might cancel out the economies of scale that you get in larger utilities. Thanks Mike Tate for that observation.]
After accounting for size, groundwater systems have lower average prices than systems that use surface water, likely owing to the more complex treatment processes that surface water usually demands.
Water prices only. Thin bars represent 95% confidence intervals.
As in past studies, prices for investor-owned water utilities remain, on average, substantially higher than their local government peers. That public-private difference persists in models that adjust for size, source water, and region.

Water prices only. Thin bars represent 95% confidence intervals.
What’s next
Water and sewer prices in the U.S. continue to climb—a trend that is unlikely to change in the foreseeable future. Part 2 of this series will look at another notable trend: a subtle but persistent shift in the structure of prices that is changing the ways that utilities distribute their costs to their customers. In Part 3 we’ll look at what it all means for low-income affordability. Hint: it ain’t pretty.
*See this article for details on sampling, measurement, and data gathering procedures.
** 6,200 gallons is the volume of water that a four-person household would use in a 31-day month at 50 gallons per person per day. That’s higher than the average residential volume in most of the U.S., since average American household size is about 3.1 persons, but that makes 6,200 gallons a conservative benchmark for evaluating affordability.
When speaking on the relationship between size of sewer system vs water system and the reference to disconnect regarding system size and prices. You may want to consider that many sewer collection systems are conveyance systems and do not treat the wastewater but are sent to much larger treatment plants that operate as a regional collection point for many sewer districts. The size of the water system can have a greater effect on system demand and directly affects water production and increased for power consumption, water treatment costs, regulatory monitoring of potable water, and the infrastructure to support a public drinking water system.