How much consolidation is enough?

you know it when you hit the sweet spot
There’s a growing consensus that there are way too many water utilities in the United States.
America’s 50,000 community water systems are operated by tens of thousands of local governments, tribal agencies, investor-owned firms, nonprofit co-ops, and private companies. That’s an order of magnitude more utilities than the electrical and gas sectors combined. Water systems also are highly skewed in size: the largest 444 systems serve about half the U.S. population; but more than half of the nation's water systems are tiny, serving fewer than 500 people and collectively serving barely 1% of the U.S. population.
That extreme fragmentation has profound implications for virtually every aspect of the American water sector. Consolidation won't solve all of the water sector's problems, but without significant consolidation no other reform is likely to work in the long run.
I’ve advocated for significant consolidation for some time, and momentum for a serious effort at tackling water sector fragmentation is beginning to grow. State governments increasingly look to consolidate water systems. Conferences, workshops, and panels on the consolidation have proliferated among professional societies and advocacy organizations over the past two years.* Earlier this year the California Water Board published an impressively comprehensive Drinking Water Needs Assessment highlighting the dire conditions of that state’s small systems and evaluating opportunities for consolidation. EPA is even taking a few cautious steps to align incentives toward consolidation.
As the tide begins to turn away from hand-wringing over “local control” and toward sustainability, it’s worth asking: what is the consolidation sweet spot?
How much should we consolidate? How big is big enough?
Data on water quality compliance, management performance, costs, and rates all point to a scale of consolidation that gives us the best chance at sustainable drinking water in America.
Read on to find out...
Economies of scale
Water utilities, like most other producers, enjoy huge economies of scale. “Economy of scale” means that the average cost of producing something declines as the scale of production increases. The most obvious example—and the one that people immediately think of with water utilities—is physical capital. A large treatment plant is more expensive than a small one, but the large facility can serve many more people at a lower average cost per customer or per gallon.
But economies of scale extend beyond plants, pipes, and reservoirs. Compared with smaller utilities, larger utilities can:
- Buy commodities, equipment, and other goods at lower average prices.
- Borrow money at lower interest rates.
- Set more progressive rates for greater affordability.
- Attract and promote higher quality employees than small systems.
These advantages have dramatic impacts on utilities' effectiveness and efficiency.
Water Quality & Management Performance
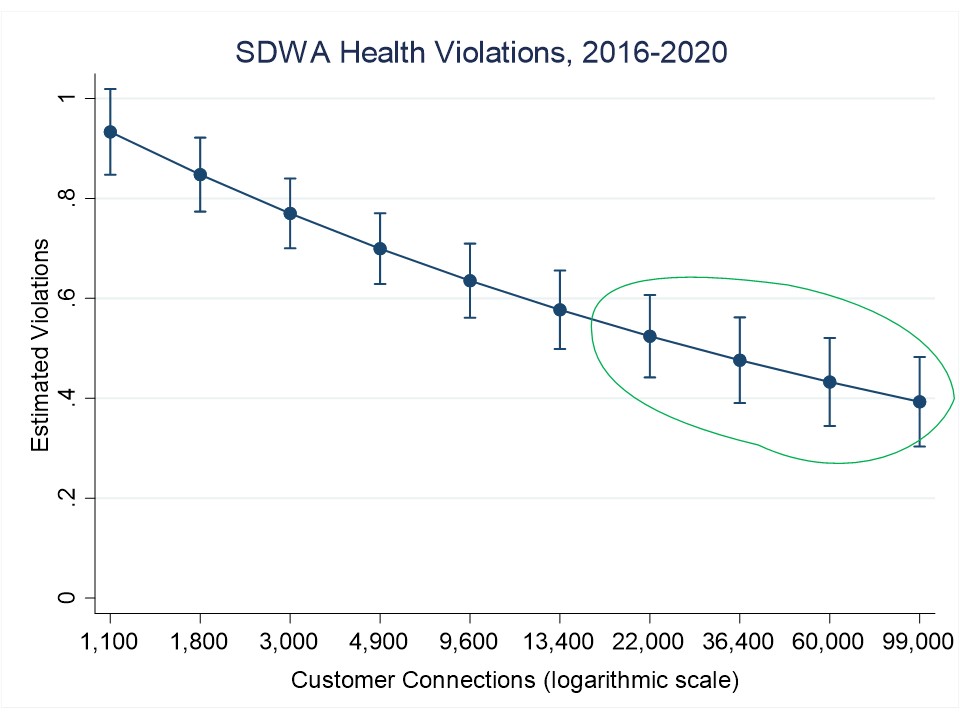
Here’s the relationship between system size and violations of the Safe Drinking Water Act’s (SDWA) heath standards—recently updated with national data from the past five full years (2016-2020):
And here’s the updated analysis of SDWA monitoring and reporting (i.e., management) violations:
These curves are familiar to SDWA analysts and regular readers of this blog: the steady downward slopes indicate fewer violations as utilities increase in size. The vertical spikes represent confidence intervals—a measure of how precise our statistical estimates are.
Violations of both types drop dramatically when the number of customer connections increases from 1,100 to about 22,000. Above that size, estimated violations continue to drop but not so dramatically and with less statistical significance. The ranges circled in green toward the lower right of those plots represent diminishing marginal returns to scale. That’s a fancy way of saying that the greatest effects of scale on water quality and management performance are from zero to around 22,000 customers—a utility that serves a population of roughly 60,000.
In other words, the sweet spot is in the green circles.
Keep those figures in mind.
Operating Efficiency
We expect average capital costs to be far lower for larger utilities with larger facilities. But data from the Public Service Commission of Wisconsin show how average operating costs also drop in larger utilities. The PSC reports detailed operating cost information for more than 500 utilities in the Badger State, ranging from Milwaukee’s 329,000 customers to Yuba’s 34. The financial advantages of scale are immediately apparent. Here’s average annual operations and maintenance (O&M) cost** per customer and per thousand gallons of water sales by utility size:
Check out the drop in average O&M costs at the left-hand side of those graphs! These plots look different because they’re plotted on absolute, not logarithmic scales. But they convey a similar meaning. From 34 to 20,000 customer connections, average annual O&M cost falls from around $250 per customer to about $70. Average O&M cost per thousand gallons drops from $6.00 to less than $2.00 over the same range. Average O&M costs continue to decline as size increases, but they level off in the ranges circled in green.
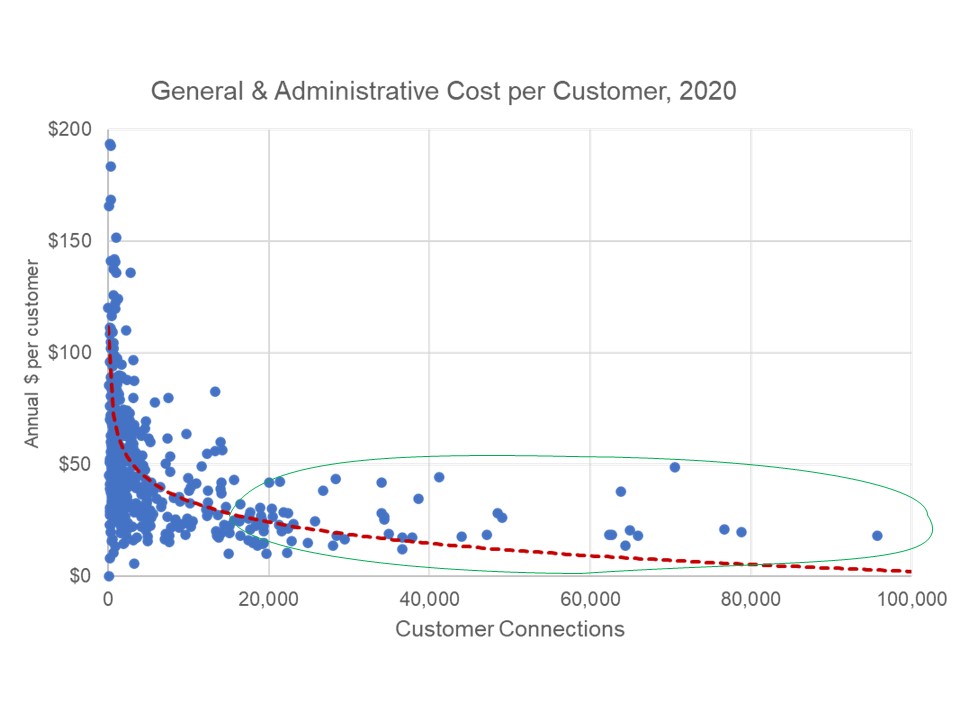
Of course, those O&M efficiencies could still be related mainly to larger facilities. What happens when we isolate administrative overhead and customer billing costs?
The same relationship emerges: annual administrative costs plummet from more than $100 per customer for very small utilities to around $25 for utilities with around 20,000 customers. Administrative costs level off in the area circled in green—about 20,000 customers and up.
Again, the sweet spot is in the green circle. If we can get utilities into that range we're likely to get the operating efficiencies we need.
Residential Prices
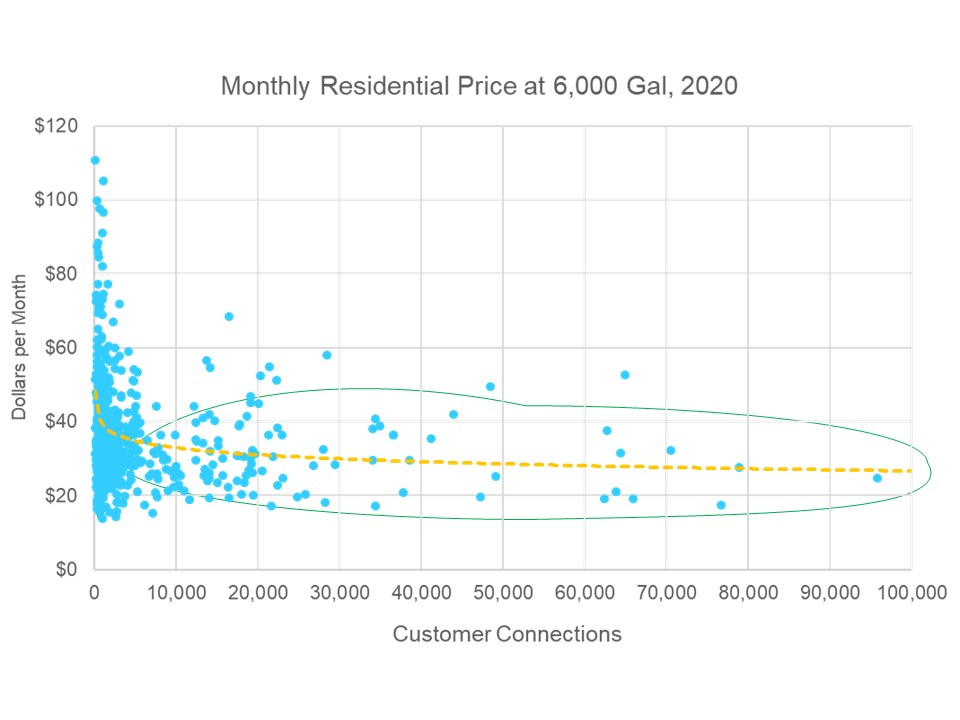
Those operating efficiencies have a clear relationship with the prices at the tap. Here are monthly residential water bills at 6,000 gallons for the same Wisconsin utilities in 2020, again plotted over total customer connections:
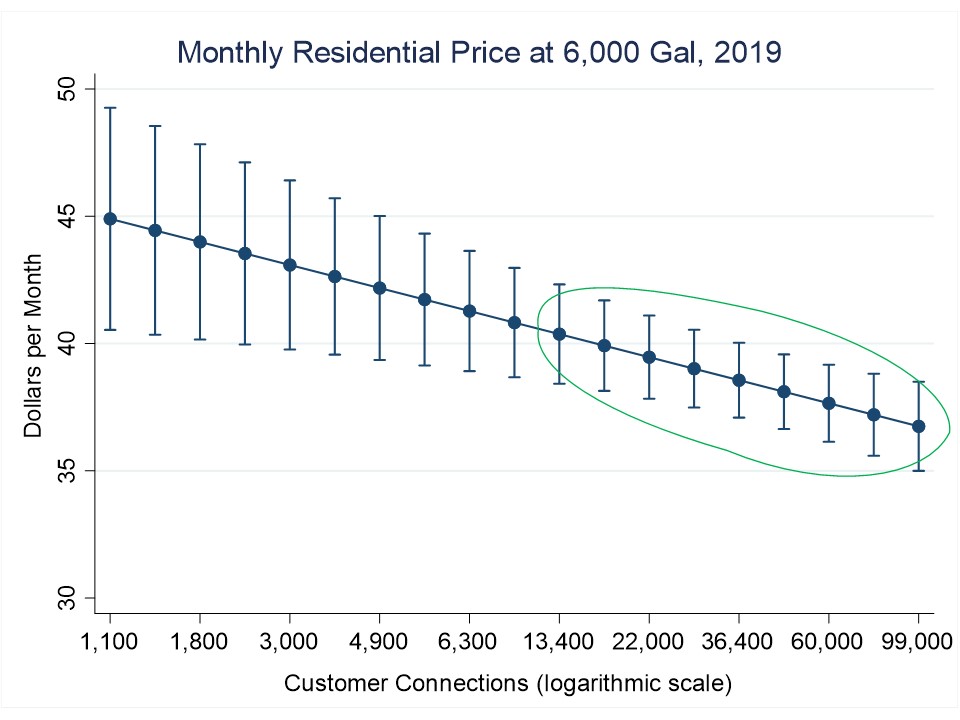
Once again prices fall drastically as utility size increases, although this time the curve begin to level out around 10,000 customers. That correlation is consistent with nationally representative data that Robin Saywitz and I collected in 2019:
Noticing the trend here? Nationally, the greatest impacts of scale on residential water prices are from zero to around 15,000 customers—a utility that serves a population of roughly 45,000. Prices continue to fall as size increases, but the gains from scale aren't as significant.
Right-sized
Whether we look at water quality, management performance, operating efficiency, or prices, a remarkably consistent picture of water utilities and economies of scale emerges from all these graphs. The greatest potential improvements from consolidation come at the at the low end of the distribution—from a few dozen to around 20,000 connections (or roughly 60,000 in population). Utilities below that size will struggle to meet evolving needs with their limited capacity, and may simply be unsustainable.
Consolidation can happen when multiple systems merge, a bigger utility takes over a smaller one, or when a nonprofit co-op or investor-owned firm acquires multiple small systems. Physically integrated systems are often best where practicable, but small systems can be consolidated into larger organizations even when they’re physically separate. The right consolidation approach will vary from one place to another depending on local needs and conditions.
In any other industry this kind of consolidation would have happened decades ago. Indeed, there is evidence that when Congress passed the SDWA back in the 1970s, they expected that consolidation would happen naturally in response to the new law’s regulatory requirements. An unfortunate mix of politics, monopoly power, and lax regulation have stymied the consolidation that would have happened naturally if markets and rigorous regulation were at work.
A reckoning feels close. The inertia of fragmentation is slipping, demand for reform is growing, and leadership to guide a water sector transformation is beginning to emerge. The data suggest that consolidating the American drinking water sector to about 6,000 utilities with a minimum sustainable size of about 20,000 connections would deliver better health, greater efficiency, lower prices, and long-term sustainability.†
That’s the consolidation sweet spot.
Time to line up our shot.
*The word “consolidation” still ruffles some political feathers, so people who are more polite than I am sometimes opt for the more innocuous “integration,” “regionalization” or “partnership.”
**Excluding taxes and depreciation.
†If that number strikes you as unrealistic, consider that 25 companies in the UK provide drinking water service to a population of 64 million in England, Scotland, and Wales.


