Another way in which it’s tough to be poor
Drinking water utilities are great, but they aren’t perfect. Sometimes there are problems. Do those problems occur randomly? Or are there observable patterns in the water service problems?
Recently I’ve been posting about some findings from a Texas A&M Institute for Science, Technology & Public Policy (ISTPP) national public opinion survey. The survey’s carefully-designed sample of nearly 2,000 individuals is representative of the US population, and so offers an extraordinary look at public perceptions about water service. Earlier posts reported on attitudinal differences between water professionals and the general public, and on the ways that gender predicts opinion on water issues. I’m continuing to write up interesting findings from the ISTPP survey as time allows.
Today I’m looking at income.
Water service problems
The ISTPP survey asked respondents to say whether they had experienced each of the following problems with their drinking water with a simple yes/no answer:
- The water does not taste good (31.5% yes)
- The water is cloudy or dirty (19.5%)
- Water pressure is low (29.2%)
- The water causes sickness (3.8%)
- Water billing or payment problems (10.2%)
Importantly, this survey captures perceived water service problems, not actual problems—we don’t know that any given respondent actually experienced low water pressure, for example. We only know whether a respondent thinks (s)he experienced a problem. Likewise, we don’t know whether water actually caused sickness, only whether the respondent believes that it did. Fortunately, the large majority of respondents said “no” to all of these.
But the “yes” responses didn’t happen by chance. I fitted logistic regression models to identify correlates of water service experiences using the demographic variables in the ISTPP survey, such as race, ethnicity, age, urban/rural location, region, and income. These models estimate the likelihood of experiencing each of the five service problems.
A troubling pattern
The demographic correlates of water service problems vary, but across all five items, household income was the single strongest and most consistent predictor of water service problems. The graph below shows the likelihood of reporting that water billing problems at various income levels, with all else held equal (vertical spikes represent 95% confidence intervals):
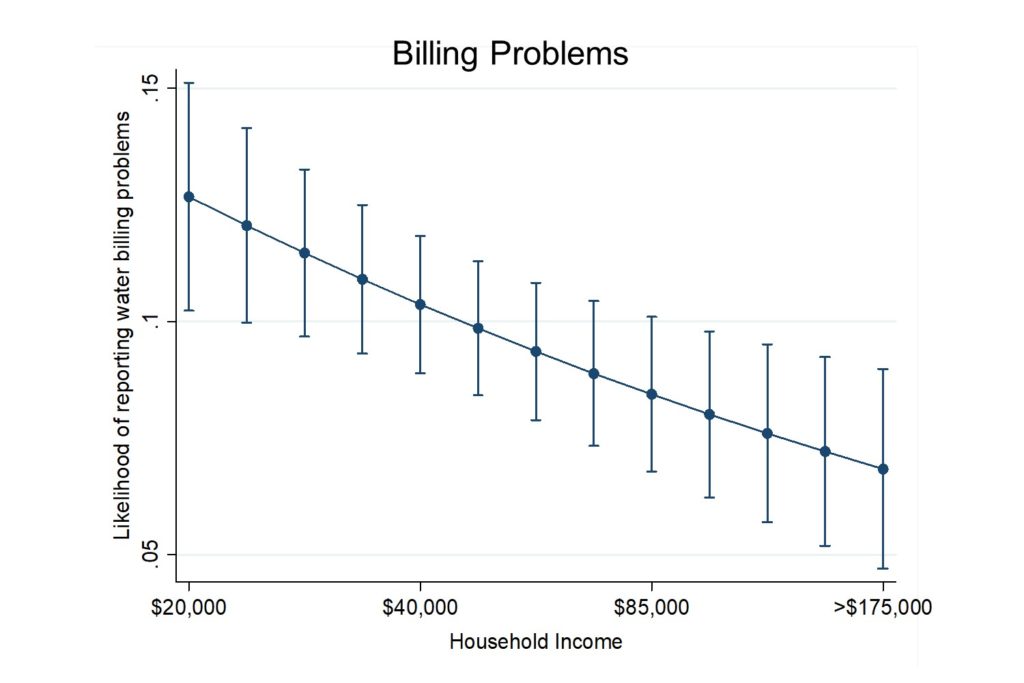
At a $20,000 household income, there is a 13% chance of reporting billing problems. At $50,000, the likelihood is to about 9%; at $100,000 the likelihood drops to about 8%. That all makes some sense; we’d generally expect billing problems to correlate with income.
But the same pattern emerges for other kinds of water service problems, too. Here is the likelihood of reporting that water tastes bad at various income levels, again with other variables held constant:
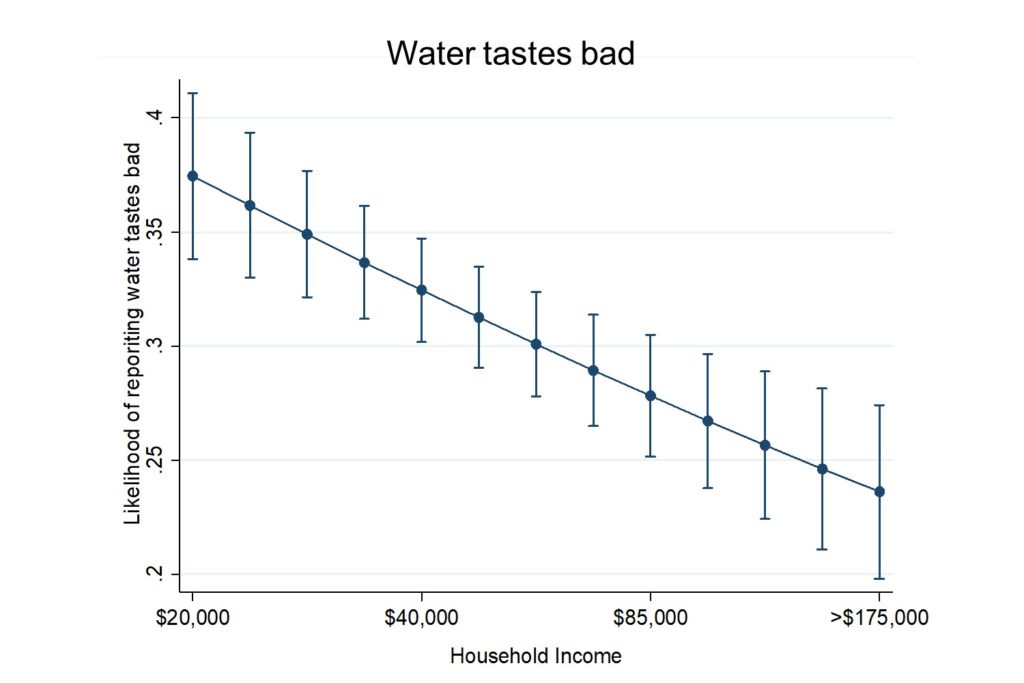
At a $20,000 household income, there is a 37% chance of reporting bad-tasting tap water. At $50,000, the likelihood is to about 30%; at $100,000 the likelihood drops to about 25%.
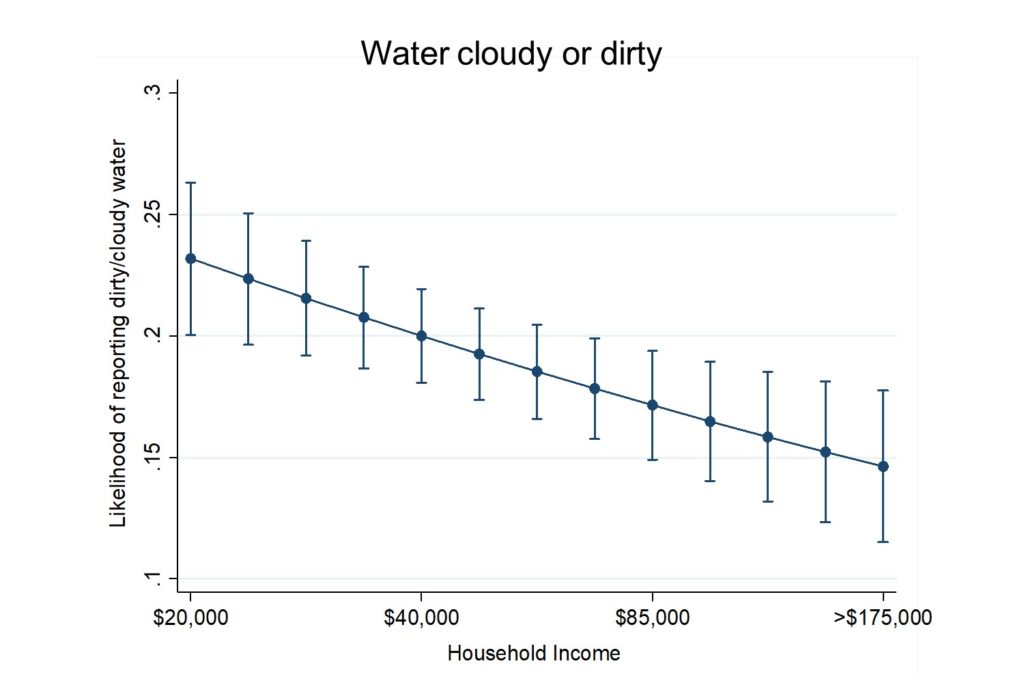
Here’s the likelihood of experiencing cloudy or dirty water by household income:
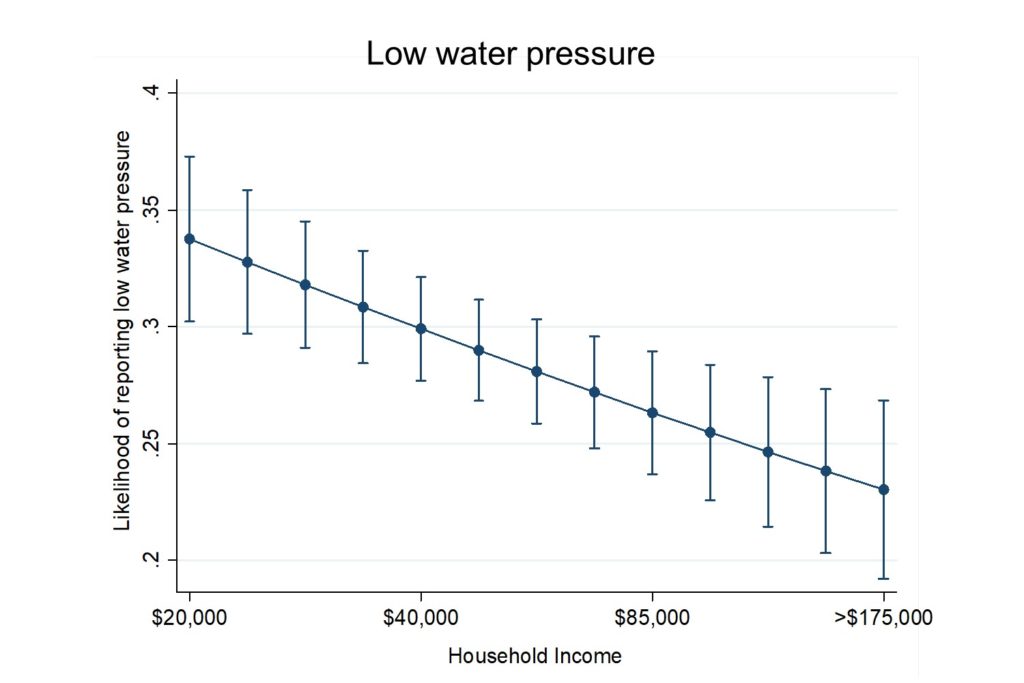
Here’s the likelihood of reporting low water pressure by income:
And finally, here’s the likelihood of reporting that water caused illness by income:
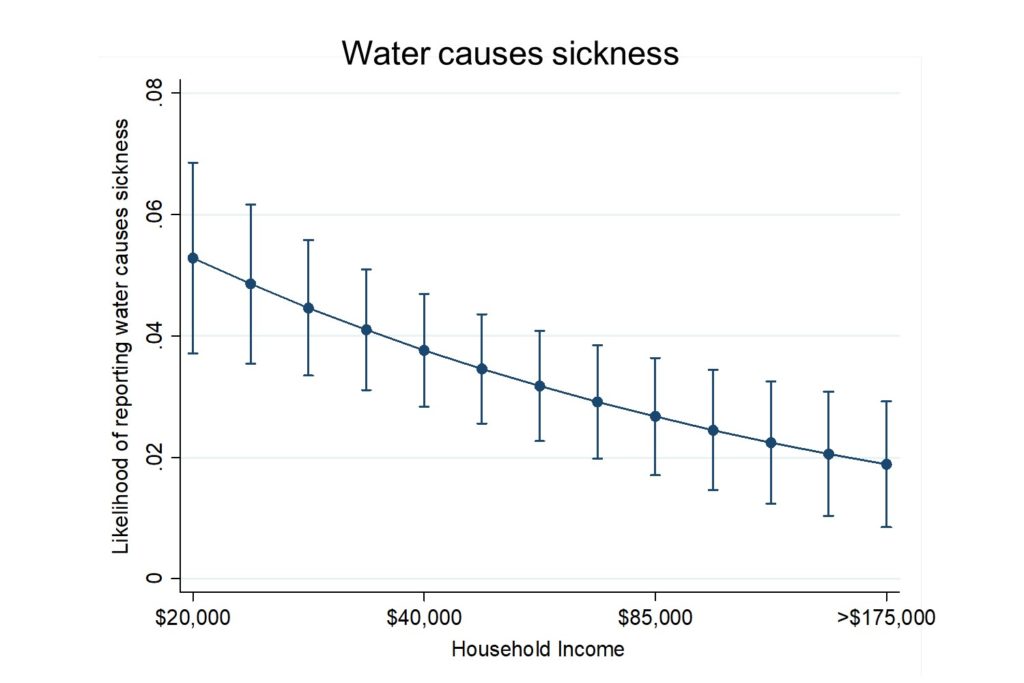
Taken together, this is a sobering picture.* There is a clear relationship between income and the way that Americans experience their drinking water utility service. These results resonate with recent research finding a positive relationship between tap water consumption and income, with attendant implications for public health.
*In a future post I’ll look at race and drinking water experience; the picture won’t be much prettier.
Manny:
I listened to your seminar today. Regarding income and perceived problems, one hypothesis is that wealthier citizens are probably more likely to use either point of use treatment (like RO or activated carbon) for their drinking water or water softening at the point of entry (or at least, for the hot water side), thereby reducing unseen threats (like lead), poor taste (carbon) or scaling (water softening), hence don't report these problems because they actually don't exist.
For example, I discovered, about 20 years ago, that water softening was almost perfectly correlated with income in Phoenix, even though the whole area had hard water.
Good observations. My colleagues wondered the same thing and we've looked at some of the hypotheses you raise. We have data from a couple of other, more recent surveys on use of in-home filtration (whole-house, sink-mounted, or refrigerator carbon or RO) and how it relates to bottled water use. Consistent with your ideas, we find that income positively predicts use of home filtration, but negatively predicts bottled water use.
Interestingly, distrust of tap water quality predicts bottled water consumption but *not* filtration use. It appears that people who use home filters do so mainly for aesthetic reasons, not out of a concern for health.
That may be changing, however. I have a feeling that increasing worries about nitrate and especially PFAS may have more people using filtration due to health risks. It's an empirical question, so we'll need to keep an eye on how the trend changes.
Thanks for bringing up softeners–that hadn't occurred to me (even though there's one in my own home!). I'll try and get that into the questionnaire next time we run a survey!