
Biennial water & sewer affordability update, part 2
Economics is the study of tradeoffs. To have more of this, you have to sacrifice that. You can have A or B, but you can’t have infinite amounts of both. As you get more and more of X, you’ll like X less, and you’ll start wishing you had more Y. Tradeoffs are depressing, man. There’s a reason they call economics the dismal science.
Tradeoffs were on my mind when I developed new ways of measuring and evaluating water and sewer affordability: what sacrifices do low-income households have to make in order to pay for those essential services? What can’t a working class customer do because (s)he has to pay a water and sewer bill?
This is the second of three posts discussing findings from my 2025 biennial wave of national water & sewer rates data. The first post reported on trends in pricing and rate structures; this one focuses on affordability (the word of the year in America, it seems). The latest data offer some lessons about the tradeoffs at heart of the affordability challenge and reveal some interesting—and quietly encouraging—insights.
TL:DR
In 2025, the average cost of basic monthly water & sewer service was the equivalent of 8.6 hours of labor at minimum wage, requiring an average of about 14% of discretionary income for a household at the 20th income percentile. But affordability nationwide appears to be stabilizing, thanks in part to gains in residential water efficiency.
Affordability trends
I use two complementary metrics to evaluate affordability*: Hours at Minimum Wage (HM) and the Affordability Ratio at the 20th percentile of household income (AR20). HM is an easy, intuitive way to think about affordability for a working class customer: it’s the number hours that someone would have to work at the local minimum wage in order to pay for a month of water and sewer service. Here are national average HM value from 2017-2025, at the old benchmark of 6,200 gallons and the new 4,800 gallon benchmark:
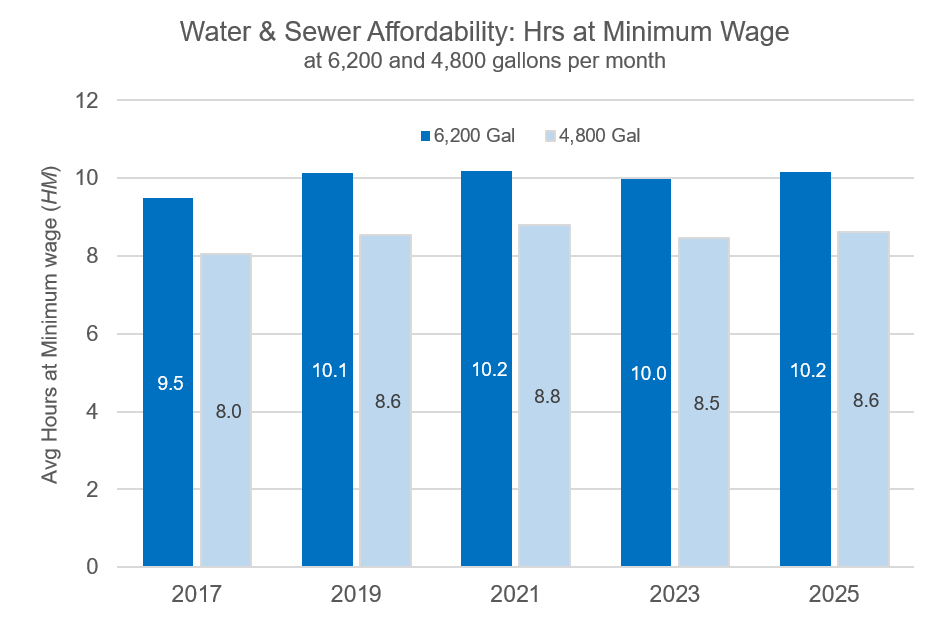
U.S. average HM values have effectively held steady since I first started collecting nationally representative data. In 2025, a month of single-family residential water/sewer service at 4,800 gallons required an average of 8.6 hours of labor at minimum wage—slightly higher, but statistically indistinguishable from 2017’s average HM. Although average prices have gone up steadily over that time, minimum wages have gone up in much of the U.S., too. (Coincidentally, that national average aligns nicely with the HM affordability rule of thumb that I proposed). Working class wages vary considerably across the country, but in broad terms, wages have risen at roughly the same rate as water bills over the period of analysis. That’s a welcome signal of stability.
The AR20 numbers tell a more complicated story. AR20 is the price of basic water/sewer service as a percentage of discretionary income for a household at the 20th percentile of the local income distribution. AR20 offers a more nuanced look at the tradeoffs working class families face, since it’s sensitive to differences in local costs of living.** Here are biennial national average AR20 values from 2017-2025:
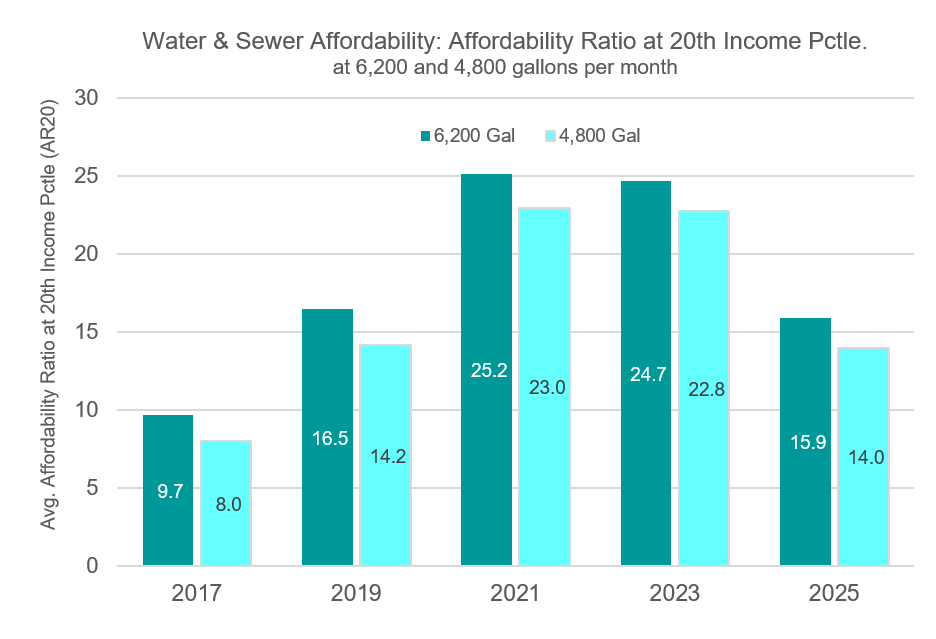
After sharp increases from 2019-2023, average AR20 fell to 14.0 in 2025. In substantive terms, a household at the 20th percentile of the local income distribution had to pay about 14% of its discretionary income on water/sewer service in 2025. The recent decline in average AR20 amidst rising water/sewer rates reflects some rising wages and fluctuating prices for various essential goods—as well as increasing stability in the underlying consumer data as weird COVID-era consumption patterns fade into the rearview mirror.
Both metrics maintained their familiar skewed distribution in 2025. A majority of utilities satisfied my affordability rules of thumb, with 56% generating HM values below 8.0 and 67% showing AR20 values below 10.0. Affordability problems in those communities are probably manageable.
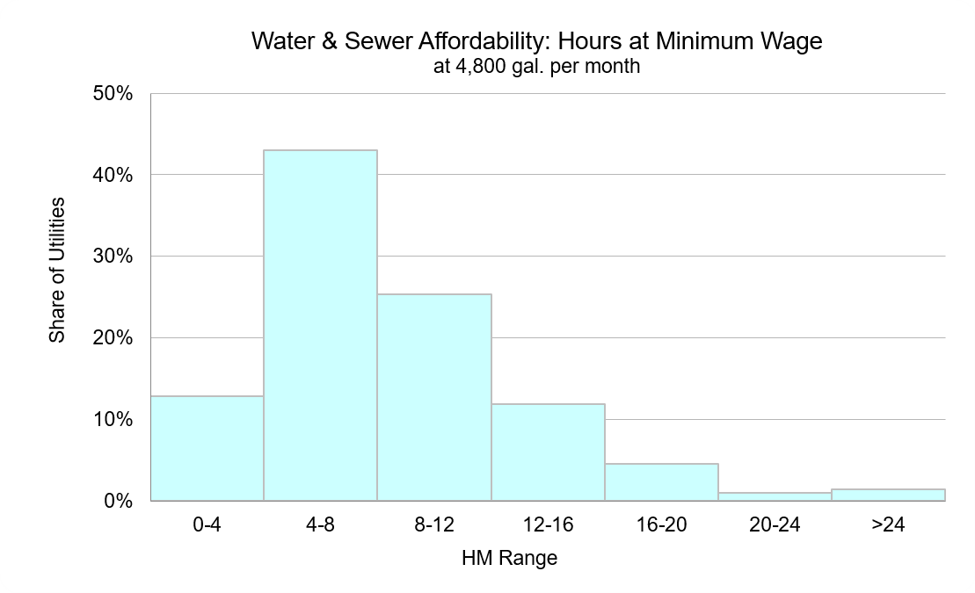

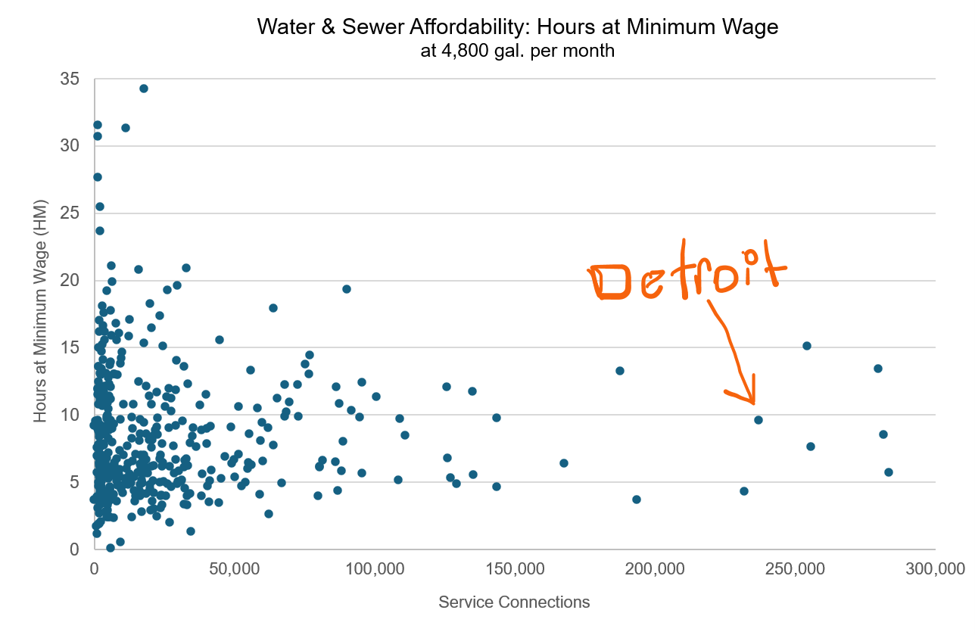
The real trouble comes in the right-hand tails of those distributions. Each of those long tails reveals a different underlying challenge: extreme values of HM probably reflect high prices; extreme values of AR20 indicate very low incomes. Scatterplots of these affordability metrics over utility size give a clearer look at what’s going on:
x-axis truncated at 300,00 to ease interpretation
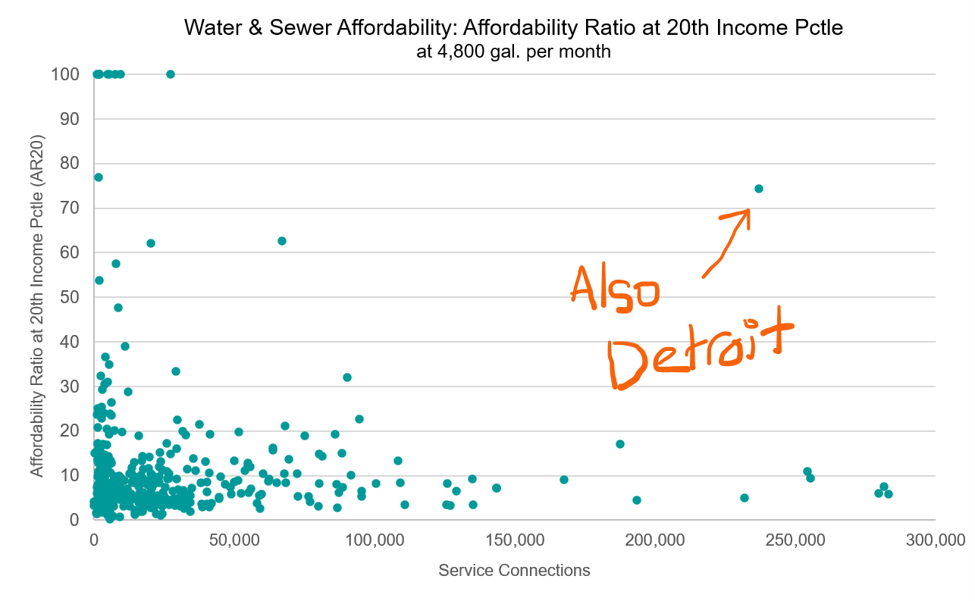
x-axis truncated at 300,00 to ease interpretation
Two things to notice here. First, most of the extreme values of both HM (say, >15.0) and AR20 (>20.0) appear in utilities that serve fewer than 25,000 connections. In many cases, affordability challenges toward the left side of these graphs reflect the structural costs of operating small systems and the potential affordability advantages of consolidation.
The other thing is that those very high AR20 values have more to do with local income distributions than with the size of bills. Consider Detroit, where basic residential water & sewer service cost the equivalent of 9.6 hours at minimum wage in 2025–above the national average but not egregiously awful. However, annual household income at the 20th percentile in the Motor City was less than $13,000 last year, leaving Detroit with a staggering AR20 of 74.2. Could Detroit reduce its costs in ways that make service more affordable? Maybe, but I’d guess they’re already running pretty lean and mean. With incomes that low, utility bills are going to be unaffordable for significant numbers of households no matter how cheap they are. Managing affordability in Detroit is a utility finance Kobayashi Maru test.
Dismal, indeed.
An unheralded triumph
Amidst all the dreary numbers, it’s easy to miss an extraordinary development: widespread efficiency gains mean that the American water sector is delivering value in a way that quietly advances affordability.
With no evidence that we’re choosing to live dirtier or thirstier, falling indoor water demand implies that today American families derive the same or more value from 4,800 gallons a month that they used to get from 6,200 gallons per month a decade ago. We’re still drinking, cooking, cleaning, washing, and flushing, but we’re doing it with far less water. Thanks to efficiency, average monthly bills for essential water/sewer service increased by just nine dollars over eight years.
When I started in the water business back in the 1990s, folks simply assumed that water consumption would increase, more or less linearly, as the population and economy grew. Long-range engineering and resource planners anticipated a world with ever-bigger and more expensive water projects. But in the mid-90s that started to change: growth in urban water consumption slowed and then reversed, with demand falling even as the population and economy grew.
That didn’t happen by accident: it’s the fruit of decades-long efforts. Organizations like the Alliance for Water Efficiency built a body of water efficiency research and pushed for changes to public policy and private behavior. Policies at the federal, state, and local levels promoted and sometimes mandated more efficient water use. Researchers, investors, and manufacturers responded by developing and marketing effective technologies to take innovations from drawing boards into homes. America’s dramatic increase in household water efficiency is a remarkable success story with the public, private, and nonprofit sectors working together; we don’t hear about it nearly enough.

well when you put it that way
Those efficiency gains have real affordability impacts. As we grapple with daunting capital needs and increasing pressures on customers, it’s worth pondering the counterfactual world where we didn’t invest in efficiency—a world where we’d need to find new water sources and build massive reservoirs, larger treatment plants, and bigger mains to meet ever-growing demands. Rates would be markedly higher, stress on low-income households even greater, and we’d face far tougher tradeoffs. We’re much better positioned to take on the affordability challenge thanks to all that effiency.
Economics can be a cheerful science, sometimes.
Efficiency where it matters most
All that efficiency only helps low-income customers if they have efficient fixtures and appliances. Alongside discounts and other forms of billing relief, utilities ought to consider water audits and direct efficiency investments targeted at low-income customers.† Subsidizing turf replacement targets the affluent; installing 1.28 gpf toilets and faucet aerators in modest homes might not save as much water, but they’ll help keep bills manageable for families of limited means. Retrofits have the added advantage of lowering bills in the long term, without the need for ongoing assistance. As always, we need rigorous research on how to make these programs work.
In part 3 we’ll step back and take a look at the big picture that emerges from all the pricing and affordability data.
*The California Public Utilities Commission uses these metrics as official measures of affordability; several other utilities do, too.
** My default estimates define non-water essential expenses as food, medicine, health care, housing, home energy, and taxes.
† Thanks to my friend and former boss Ed Cebron at Cascade Water Alliance for this suggestion.
Here is King Co, Washington, we have the challenge of pockets of low income areas in a large regional wastewater service area which can get masked or overlooked in our affordability picture. We also have few means to help LI households since we have uniform rates and inconsistent customer assistance programs administered by partner agencies. Question for you is whether there is an analog in the wastewater world for the positive effect on affordability from efficiency measures taken in the DW world?