
About that Food & Water Watch Affordability Report...
The advocacy group Food & Water Watch recently published a report on residential water costs and affordability and launched a media campaign that got significant media coverage.* Drawing on rates data from the largest 500 U.S. community water systems, they arrive at some headline-grabbing conclusions:
- Average residential water prices are up 62% since 2015, roughly 1.6x faster than inflation.
- America faces an “affordability crisis,” with 93% of utilities “unaffordable” for low-income households
- “Corporate control” is to blame, with private water companies charging average prices 67% higher than municipal water utilities.
- State/local governments should “ban water privatization,” and the federal government should “fully fund safe and clean water in every community.”
I got a bunch of questions and media inquiries about the F&WW report, so I took a deep dive into their data, methodology, and conclusions. This post is about what I found.
As we’ll see, F&WW accurately identifies symptoms, but misdiagnoses the disease and prescribes the wrong treatment.
TL:DR
Food & Water Watch’s pricing data are valid, but their affordability figures are questionable. Sins of omission lead F&WW to the wrong conclusions. You can trust their price figures, but ought to disregard their policy prescriptions.
Bona fide?
Let’s start with basics: are those eye-popping prices accurate? To their credit, F&WW posted their price data for all 500 systems they measured in 2025, and coincidentally my own nationally representative pricing data were also updated last year. I’m confident about my numbers, so the two datasets offer an unusual opportunity to compare them side-by-side.
F&WW’s methodology differed from mine in a couple of ways. F&WW reports annual prices at 60,000 gallons per year; my dataset calculates monthly prices at 4,800 gal./month.F&WW looked at the largest 500 systems, while my dataset includes a stratified, randomized sample of utilities that accurately represents a much wider range of utility sizes.** But 113 utilities show up in both datasets, which allows for direct comparison. I recalculated prices at 60,000 gal/year then did my best to replicate F&WW’s methodology with my own data to make that comparison valid.
Here are F&WW’s numbers compared with mine for those 113 utilities:
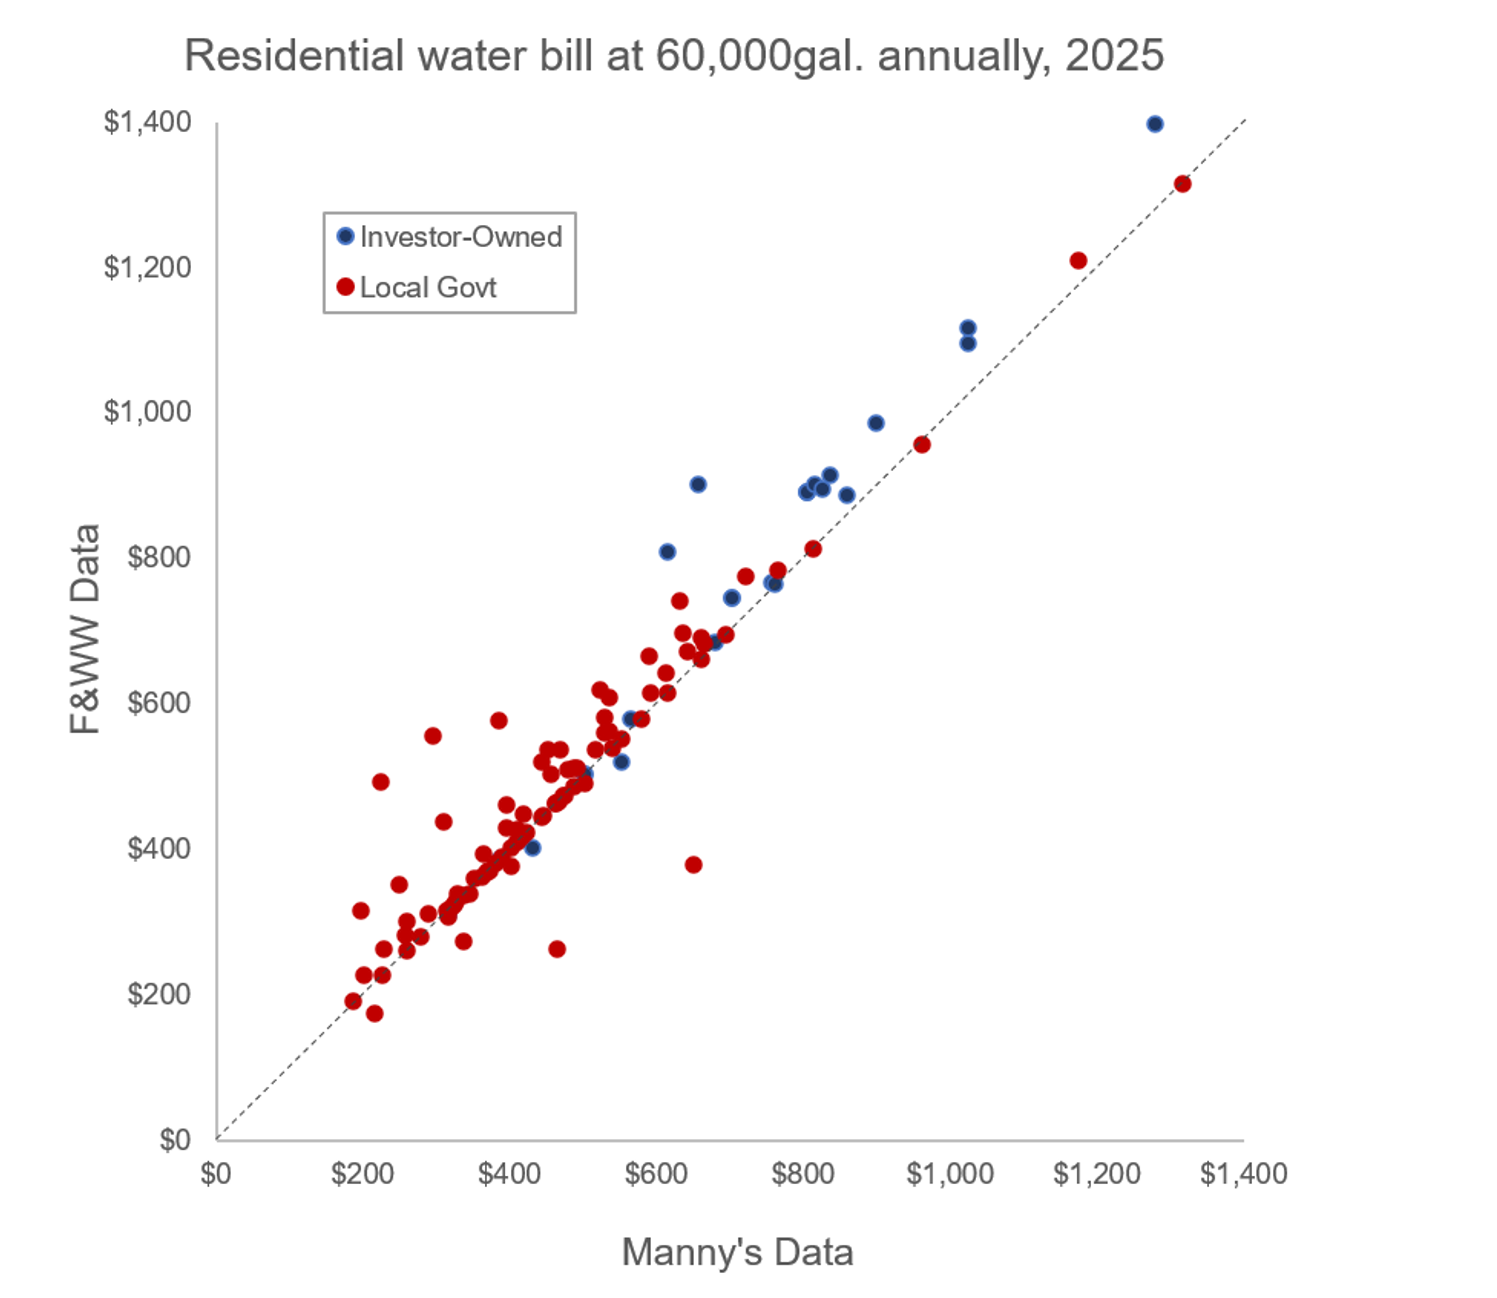
Scatterplot shows the correlation between F&WW’s and Manny’s data for 113 utilities in both datasets. Dashed line represents theoretically perfect correlation.
Our price numbers are pretty close overall—they correlate at ρ=.96. F&WW’s average household cost comes in at $549 per year for this subset, about 6% higher than my average of $519 for the same utilities. In 33 cases our calculated prices were identical down to the penny; in 68 cases, their prices were higher than mine, compared to just 12 cases where mine were higher than theirs. My data show investor-owned utilities as 57% more expensive than government utilities on average—a smaller gap than F&WW report, but in the ballpark. Arbitrary differences in measurement likely account for most differences between their data and mine (e.g., the day rates data were gathered, decisions about how to round consumption units). F&WW’s price data might be a tiny bit inflated, but they’re believable and valid for analytical purposes.
As for the price trends over time, F&WW reports a 62% increase since 2015; my own data show a 54% increase since 2017 for the 113 utilities that show up in both datasets. That’s close enough to consider F&WW’s claims about rate increases over the past ten years broadly credible. My full dataset shows a weighted average increase of just 29% since 2017, which suggests that larger systems’ prices have been rising markedly faster than smaller systems’ prices.
Ad absurdum
When it comes to affordability, the F&WW’s numbers are… questionable. F&WW’s report measures affordability as annual water price as a percentage of household income for the 20th pecentile income (or lowest quintile income) household. That calculation yields a binary result: if the price is greater than 1.5% of 20th percentile household income, water is “unaffordable.” As frequent readers know, I find this kind of arbitrary binary annoying (is there a meaningful difference between 1.4% and 1.6%?).† But 93% of utilities "unaffordable” is one of F&WW’s eye-popping headlines, so let’s roll with it.
Based on the 113 utilities in both datasets and applying F&WW’s standard, I find 54% of utilities are “unaffordable” using my price data and 58% "unaffordable" using F&WW’s price data. Those numbers are big to be sure, but nothing close to F&WW’s 93%. It's hard to explain that huge disparity. Pehaps F&WW used the wrong income data to calculate the percentage of “unaffordable” utilities...?§
F&WW’s pricing data are reasonably accurate; their affordability numbers not so much. Whether the share of “unaffordable” utilities is 93% or 54%, and whether their 1.5% metric is valid or not, affordability is still a real concern and the implications of water prices deserve attention.
Ceteris paribus?
The most serious weakness in F&WW’s report is its implication that lower water rates are always good and higher rates are always bad. And sure, all else equal, lower prices are always better than higher prices!
But all else ain’t always equal.
Assessing affordability without considering quality is like judging cars by their sticker prices. A cheap vehicle ain't better if ain't safe, and ain’t affordable if you have to spend thousands on repairs and Uber rides.

Two 1986 Mercedes sedans with different maintenance costs. One is probably more expensive than the other, but probably offers more affordable transportation.
Some water utilities are in great shape, delivering safe and reliable service with sound infrastructure, sustainable supplies, and professional personnel. Others struggle to serve their communities due to failing systems, contaminated source water, and high staff turnover. When water systems fail, customers lose trust and turn to vastly more expensive water from bottles and vending machines. And as F&WW’s report notes, lower-income, ethnic/racial minority communities are disproportionately likely to suffer from those failures—and pay more as a result.
Affordability always starts with quality.
Qui bono?
….which brings us to F&WW’s misleading treatment of the price differences between government and investor-owned utilities (IOUs). F&WW blames “corporate control” for surging water bills where private firms own utilities. But regulated rates of return are around 9-11%, so 60%+ higher prices can’t be blamed solely on corporate profits. Utilities have to be doing something useful with all that ratepayer revenue.
The F&WW study ignores the possibility an IOU's higher prices might also bring better service. Consider, for example, the government-IOU disparity in Safe Drinking Water Act (SDWA) compliance. Here are average SDWA violations by the 500 utilities in F&WW’s sample over their ten-year period of analysis:
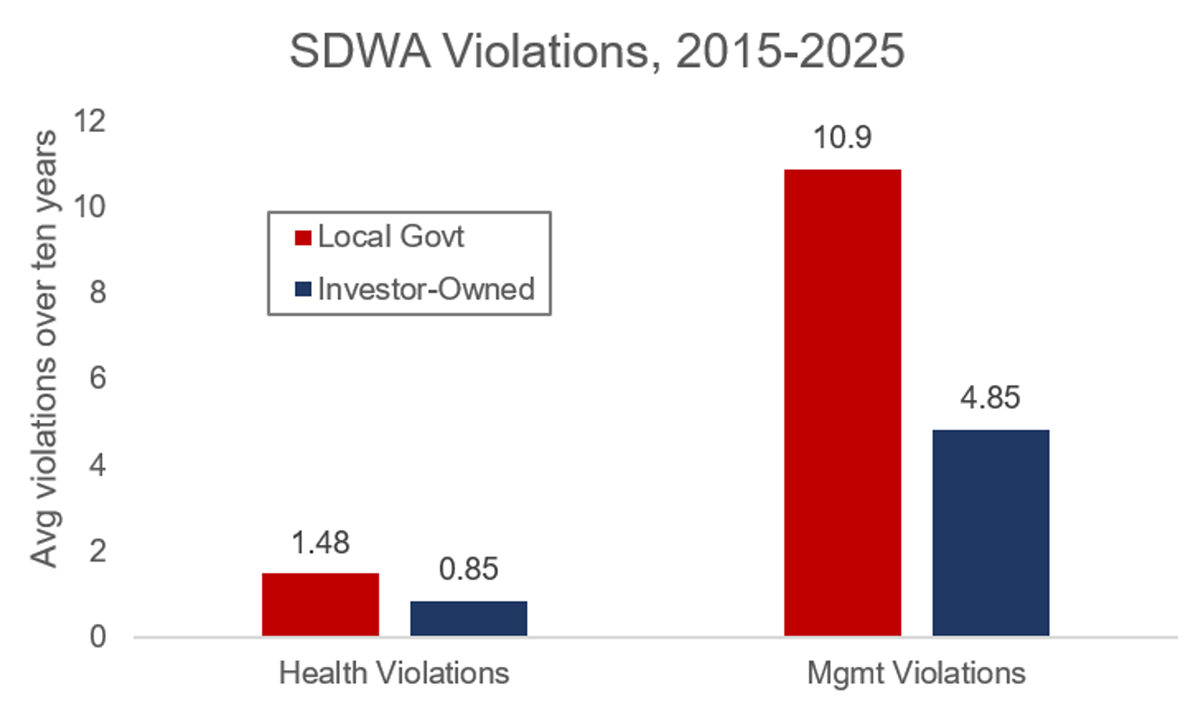
Source: EPA SDWIS.
Regulatory compliance is a blunt measure of performance, but it’s an important one. Over F&WW’s period of analysis, the IOUs in sample committed 43% fewer health violations and 56% fewer management violations than their local government counterparts. Along with dramatically higher average bills, IOU customers get dramatically safer average water by regulatory standards.
Private water companies don’t get that superior regulatory record because they’re more talented or virtuous; it’s a pattern that follows clear incentives. Under rate regulation, IOUs seek greater revenue but must link price increases to capital improvements that improve performance. Government utilities face political pressure to keep rates low, and so policymakers defer investments that might improve performance. Put simply, IOU shareholders have a financial incentive to invest proactively; local politicians have a political incentive to invest reactively when their systems fail.
Tracing that economic and political logic, Robin Saywitz and I argue in this working paper that price will correlate strongly with performance for IOUs, but weakly or not at all for local government utilities. Testing that hypothesis to F&WW’s 500 utility sample, the same pattern emerges:

Estimates from a negative binomial regression model, controlling for source water. Standard errors clustered by state. Shaded areas represent 95% confidence intervals.
Among IOUs, higher rates correlate with fewer SDWA violations over the ten-year period of analysis; at very high rates, violations approach zero for IOUs. Meanwhile, prices and SDWA compliance are effectively uncorrelated for local government utilities. Indeed, higher prices are correlated with more SDWA violations for local government utilities (though the relationship is not statistically significant). Taken together, these price and performance data suggest that prices might be too low to maintain safety for many water utilities—especially local government utilities—and that rapidly rising prices might be a needed corrective to decades of underinvestment.
Non sequitur
The main policy prescriptions in F&WW’s policy prescriptions—federal funding for water systems, state/local bans on privatization—don’t follow logically from their analysis. Rising water prices don’t imply that Uncle Sam should to step in with subsidies. Even if the government wasn’t $40 trillion in debt, more federal borrowing-and-spending on local water systems won’t address the sector’s structural challenges, and might accidentally make things worse.
Banning privatization because IOUs charge higher rates makes sense only if you ignore regulatory performance, or if cheap utility bills are all that matter to you. Since the folks at F&WW believe in “sustainable food, clean water, and a livable climate for all of us,” they ought to laud IOUs' proactive investment and sterling regulatory compliance.
Sadly missing from F&WW’s policy recommendations are effective policy strategies like water quality, rate design, and income-qualified assistance that could improve affordability in America’s large water systems.

think like Batman when reading interest group studies
Quis custodiet ipsos custudes?
Food & Water Watch are advocates, not scholars; its water affordability report was crafted to advance an agenda, not human knowledge. F&WW deserves credit for being so transparent with their data, which allows for the careful review in this blogpost. My verdict? F&WW isn’t lying, but they’re not quite telling the whole truth either. Their rates data are sound, including the stark difference between government and IOU prices; their 93% “unaffordable” finding seems off (maybe a data error?), but there’s no question that water affordability is a challenge for too many low-income households. F&WW's analysis of the public-private price gap is irresponsibly misleading, and its policy prescriptions are naïve at best, recklessly ideological at worst.
So long as advocacy groups exist they’ll produce studies that support their goals. For those of us who want safe, healthy, sustainable, and affordable water, the F&WW report is the latest reminder to think critically and read the gray literature with a skeptical eye. Caveat emptor.
*Including stories in Newsweek, Bloomberg, and The Guardian.
**F&WW’s sampling and measurement methodologies are defensible; reasonable researchers can disagree about the best way to measure water prices.
†I prefer affordability metrics that more accurately capture economic tradeoffs.
§ It’s possible that F&WW used the American Community Survey’s Mean Household Income of Quintiles (table B19081) instead of Household Income Quintile Upper Limits (table 19080). That mistake would grossly underestimate 20th percentile income and greatly increase the number of “unaffordable” systems. Hard to know for sure. ¯\_(ツ)_/¯