A reasonable expectation
What low-income households pay for essential service in the United States
This post reports findings from 2017; an update for 2019 is available here.
Over the past 18 months I’ve been working to develop a valid, generalizable depiction of water and sewer affordability in the United States. There’s currently no nationally-representative dataset on water and sewer rates, so my Texas A&M research assistant Jake Metzler and I painstakingly gathered water and sewer rates data from an original, nationally-representative sample of American water utilities.* We then calculated basic single-family residential water and sewer service prices and developed affordability estimates for each utility using the double-barreled methods I published earlier this year.
All that effort is now ready to bear fruit. A forthcoming AWWA Water Science article reports the full methodology and findings in gory academic detail. If there’s interest here, I’ll share more about our findings here over the next few weeks and months – without the academic gore.
Today I’ll start by sketching the basic picture: how we measured affordability, and how affordable water and sewer services are in the US.
The sample & data
We drew our sample from the EPA’s Safe Drinking Water Information System (SDWIS), which SDWIS contains basic system information for the country’s nearly 50,000 water systems. An overwhelming majority of systems serve fewer than 3,300 people, and so a simple random selection would result in a sample of mostly small systems that collectively serve a tiny minority of the total population. So we stratified the sample—that is, we intentionally “oversampled” different kinds of utilities in order to get a wide variety of systems. Our analysis then adjusted mathematically for the sampling procedure to make sure we get truly representative results.
Single-family residential rates data were collected in the summer of 2017. To call the process laborious is an understatement (I’ll probably blog about that some other time!). For most large and medium-sized utilities, rates data were readily available on websites. When rates were unavailable online—especially common among smaller utilities—we inquired by telephone, repeating calls as necessary. Efforts to collect rates data were abandoned after multiple refusals or non-responses. The final dataset included full water and sewer rates data for 329 utilities. That might not seem like much, but it’s a larger sample than most, it’s representative, and we’re highly confident in the validity of the data.
Basic water & sewer as share of disposable income
We measured affordability in two ways; the first is with the Affordability Ratio (AR).
AR estimates basic water and sewer costs as a share of disposable income, which for present purposes is total income minus essential living costs (taxes, housing, food, health care, and home energy), estimated using Consumer Expenditure Survey data. To focus on low-income households, we measure AR at the 20th-income percentile (AR20). The 20th percentile household typically identifies the lower boundary of the middle class. These working poor households have very limited financial resources, but may not qualify for much public assistance.
Here’s what we found:

AR20 averaged 9.7. In substantive terms, that means that in the average utility, a household at the 20th income percentile must spend about 9.7 percent of its disposable income on basic water and sewer service. But AR20 varies widely, from a low of 0.6 to a high of 35.5. As the figure above indicates, AR20 is less than ten for about two-thirds of systems. A handful are very high—but these values reflect very low 20th percentile incomes as much as they do water/sewer costs.
Basic water & sewer in hours at minimum wage
My other way of measuring affordability is to express basic water/sewer costs in terms of Hours’ Labor at Minimum Wage (HM). This approach may not express affordability quite as accurately, but it’s precise and wonderfully intuitive: it represents the cost of water/sewer service in terms of labor. For those of us who have worked at minimum wage at some point in our lives, it is a powerful way to understand the cost of something.
Here’s affordability in the United States measured as HM:
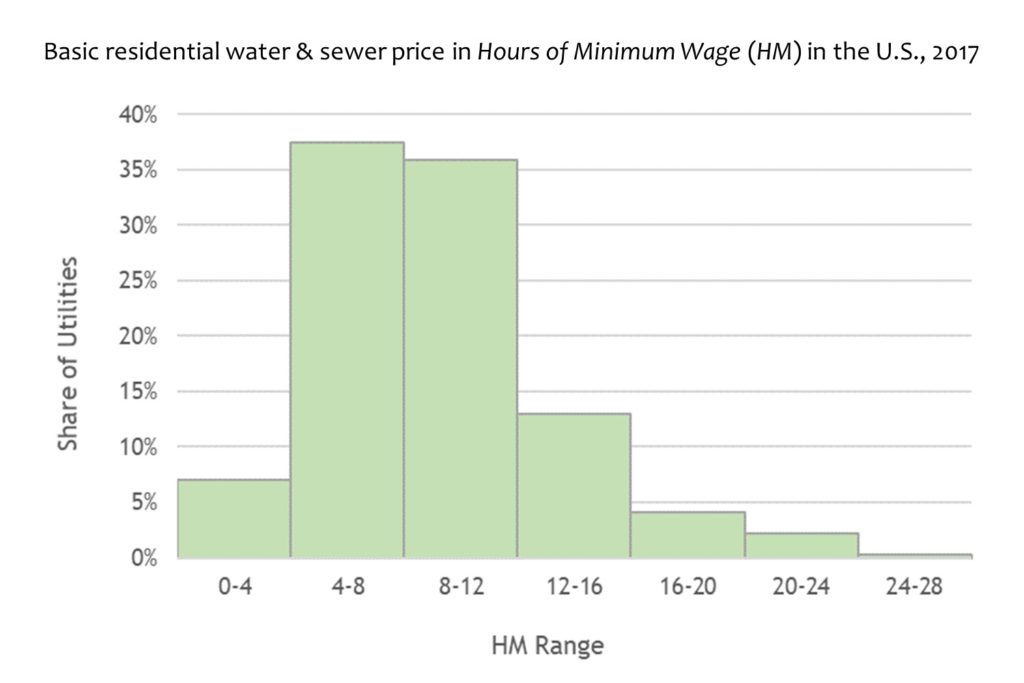
As you’d expect, the distribution is very similar to AR20, ranging from 1.1 to 25.6. The overall average is 9.5, meaning that in the average utility, paying for basic water and sewer service requires about 9.5 hours of labor at minimum wage.
So is water affordable in America?
When confronting affordability, utility leaders are really asking: how much is it reasonable to expect households of limited means to pay? What economic sacrifices are reasonable?
These are ultimately questions about community values. There is no scientific answer to philosophical questions. No metric can define what is “affordable,” but good measurement can help us think about our values.
In the past I’ve suggested AR20 less than 10% and HM less than 8.0 as rules-of-thumb or point of departure to guide discussion. By these guidelines, 51 percent of the sampled utilities are affordable as measured by AR20 and just 39 percent are affordable according to HM.
Looking ahead
We’re now in the process of analyzing the policy, organizational, economic, and demographic correlates of affordability. I’ll be publishing and blogging about what we find over the next several months. For now, I hope these figures provide some food for thought and help frame an agenda for tackling a tough issue.
*Collecting rates data is surprisingly difficult labor-intensive. Jake and I wrote a fun article on that topic–look for it next month.
Good stuff Manny! Looking forward to reading the data collection article from you and Jake. I’m continually hopeful those of us in the water community can collaboratively put our various datasets together to combine their power and our learning potential. Could help us start to answer questions where water quantity, quality, rates and affordability all intersect.
Manny, this is great stuff! What are the chances that you could talk to my students next semester (over Skype or Zoom) about this research? I’m teaching a water policy class for a mix of graduate and upper-level undergraduate students and I think this would really (REALLY) interest them. If you are amenable to entertaining the idea I can send you an email with more details. Cheers!