An update on what low-income U.S. households must pay for essential service

About a year ago I also published the results of a national study of affordability using these new metrics using data from a nationally-representative sample of utilities in 2017. This year, I’ve been working with Texas A&M graduate student Robin Saywitz to update that study for 2019 with fresh data and an expanded sample of utilities. A working paper details the full methodology and results for the 2019 update; this post reports the main findings.
Water and sewer affordability remain at the forefront of discussions among utility policymakers, managers, and regulators as communities across the country face rapidly rising capital, maintenance, and replacement costs. Since good policy requires good measurement, I’ve spent a lot of time in recent years evangelizing for a new, double-barreled measurement approach published early in 2018: the Affordability Ratio and Hours at Minimum Wage. These metrics are designed to capture the sacrifices and trade-offs that low-income households face when paying for these essential services.
Sample & data
There’s no central repository for water and sewer service rates in the United States, so valid depictions of affordability requires gathering data directly from utilities. We drew our sample from the EPA’s Safe Drinking Water Information System (SDWIS), which contains basic system information for the country’s nearly 50,000 water systems. To get a representative picture of the nation’s affordability we stratified the sample and then randomly selected systems. Our analysis then adjusted mathematically for the sampling procedure to make sure we get representative results.
We collected rates data during the summer of 2019 with an active survey—that is, we gathered rates information directly from utilities rather than relying on responses to questionnaires. The final dataset included full water and sewer rates data for 399 utilities—an increase of 70 systems compared with the first study.*
Basic water & sewer share of disposable income
The first main metric is the Affordability Ratio at the 20th income percentile (AR20), which estimates basic water and sewer prices as a share of disposable income, which for present purposes is total income minus other essential living costs (including taxes, housing, food, health care, and home energy), estimated using Consumer Expenditure Survey data.
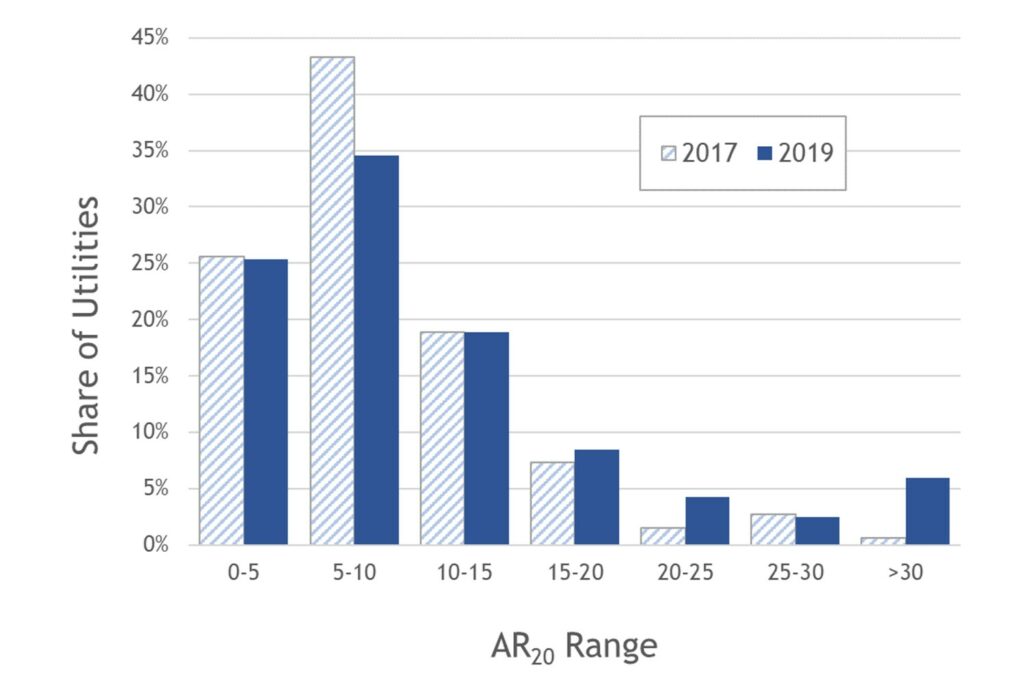
In 2017 AR20 averaged 9.7 in the United States; we found that average AR20 is up sharply since 2017, with the national average now at 12.4. In substantive terms, that means that in the average U.S. utility, basic water and sewer service prices for a four-person household consume about 12.4 percent of disposable income for a household at the 20th income percentile. Here are the distributions of AR20 for 2017 and 2019:

As the figure shows, the overall distribution has shifted markedly since 2017, especially at the high end. AR20 is less than ten for about 60% of systems, but we found a troubling growth in very high values of AR20.
Basic water & sewer in hours at minimum wage
The other way I like to measure affordability is to convert basic monthly water/sewer prices into Hours’ Labor at Minimum Wage (HM). It’s not a precise way to measure affordability, but it’s intuitively meaningful.
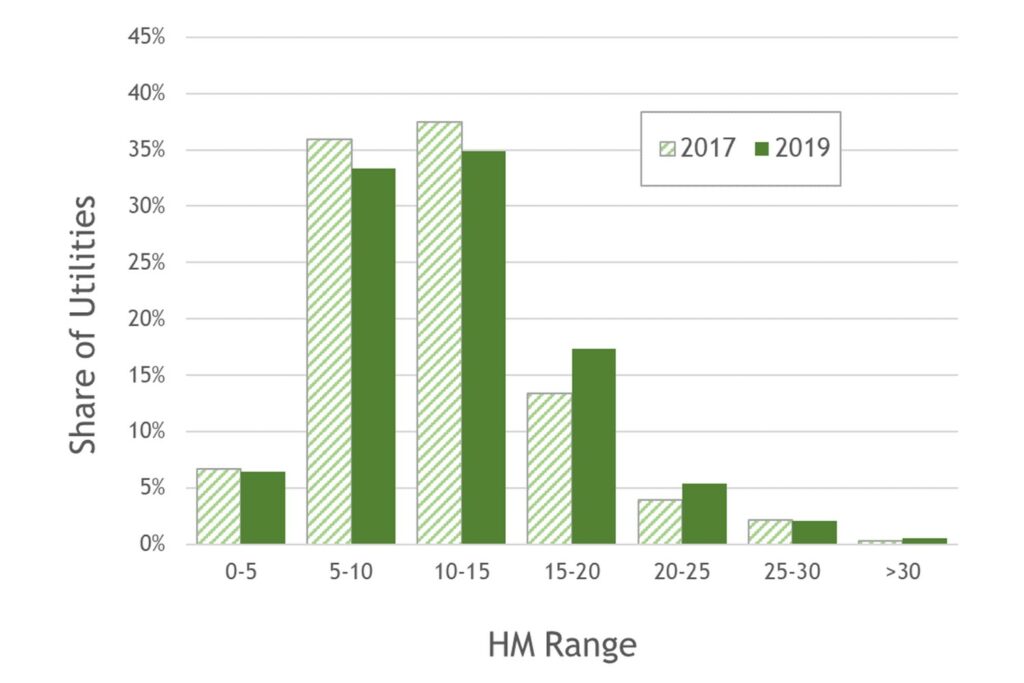
The overall HM distribution also shifted up overall, with an average HM of 10.1 in 2019. In other words, the average monthly price of basic water and sewer service for a four-person household in the United States requires about 10.1 hours of labor at minimum wage. Average HM was 9.5 in 2017, so we see an increase in 2019, but the change in average HM is not as dramatic as the change in AR20. Here’s affordability in the United States measured in terms of local minimum wage, again with 2017 and 2019 side-by-side:

So what’s going on with affordability?
Trying to infer trends from just two time periods is tough, but some important patterns are evident in the 2019 update. The most striking result overall is the sharp increase in AR20, which reflects increases in water and sewer prices, increases in essential expenditures, and stagnant or even declining 20th percentile incomes.
The more modest increase in average HM is consistent with nominal inflation, but in terms of minimum wage labor the increase of +36 minutes is noteworthy as minimum wages have not increased in many parts of the country.
We’re still unpacking what it all means, and I’ll have more to say about what the 2019 data show. For now, these figures offer another snapshot of water and sewer affordability in the United States to help frame discussion over improvements and structural reforms to the American water sector.
*399 might not seem like a very large sample for a country with 50,000 water systems, but the sample is much larger than most studies of water rates, it’s representative, and we’re highly confident in the validity of the data because we gathered the data ourselves. It’s also 70 more systems than we sampled in 2017.
© 2019 Manny P. Teodoro
