A decoupling drama plays out in San Jose
The San Jose Water Company recently proposed a significant rate increase, and its customer are understandably unhappy. Their discontent is an ironic result of success in conserving water.
Over the past year I’ve blogged about my research with Youlang Zhang and David Switzer on public and private water utilities’ responses to the drought that gripped California from 2014-2017. One of our most interesting findings was that California’s private, investor-owned utilities conserved significantly more water than government utilities. We argued that a main reason for the difference was politics and California law, which allows rate decoupling for private water utilities.*
The timing of the San Jose story was uncanny: I wrote my 2018 water conservation update just as SJWC was filing its request for the rate increase. The story of conservation and rates in San Jose is a useful illustration of why decoupling is so economically effective but politically perilous.
One city, three water systems
San Jose is unusual among large American cities in that three separate utilities provide drinking water service to its residents. The San Jose Municipal Water System (SJ Muni) is governed by the San Jose City Council, which sets the utility’s investment, operating, and financial policies. Two private water systems also serve San Jose: Great Oaks Water Company and San Jose Water Company (SJWC). Corporate boards and executives make investment and management decisions for these systems. Serving a population of more than a million, SJWC is the giant of the trio; but SJ Muni and Great Oaks are also large, each serve populations of around 100,000.
Importantly, very different processes govern price-setting for the three systems. San Jose’s elected City Council sets rates for SJ Muni. As investor-owned systems, SJWC and Great Oaks set their rates through the California Public Utilities Commission, whose members are appointed by the governor. That means San Jose voters can influence SJ Muni’s rates through their elected councilmembers. Rate-setting for SJWC and Great Oaks is a more technocratic affair, with the process handled mostly by lawyers, engineers, and economists at the CPUC.
Rates
All three systems charge fixed monthly service fees plus volumetric prices. However, their volumetric rate structures differ in subtle but important ways. The two private utilities employ inclining block rates, which charge progressively higher unit prices as volume increases. For example, SJWC customers pay $3.20 per hundred cubic feet (ccf) for the first three ccf; prices jump to $4.80/ccf for the next 15 ccf, and then to $6.40/ccf for volume beyond 18 ccf per month. Great Oaks uses a similar three-block rate structure, although its rates are considerably less progressive. SJ Muni uses a flat rate: customers pay the same unit price for all water, regardless of how much they use.† Here’s how these prices translate into bills for demand ranging from 0-30 ccf per month:
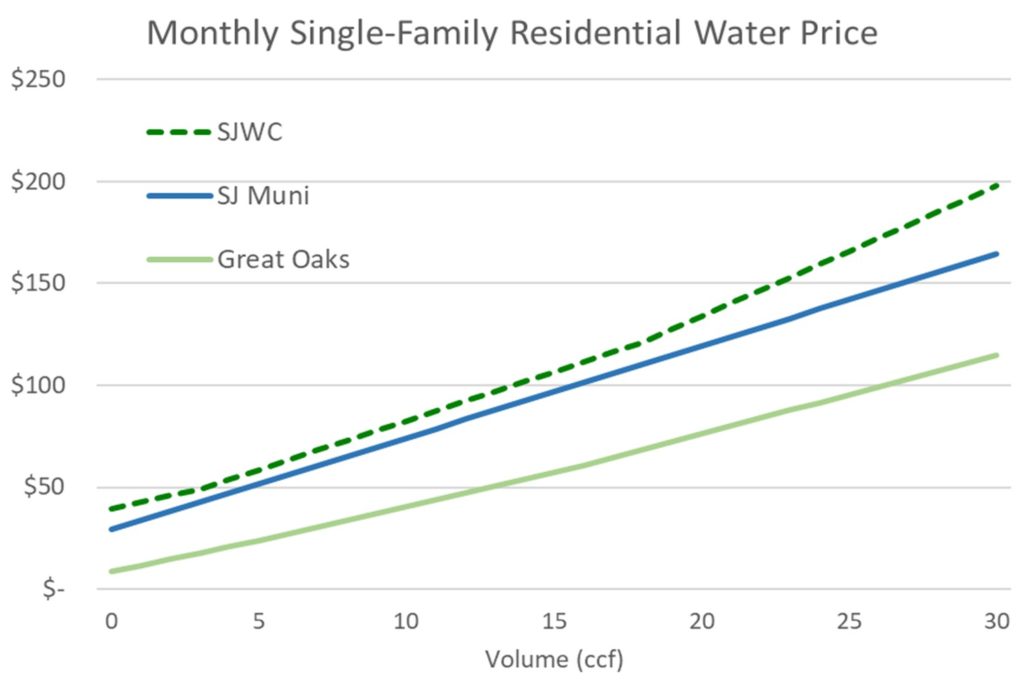
Great Oaks’ prices are lowest overall. SJ Muni’s and SJWC’s prices are similar at low volumes, with the private company’s total prices about $7-10 higher through the first 15 ccf. Without detailed financial, operational, and customer data, it’s impossible to say whether that gap is justified. We can say that the gap widens at higher volumes due to SJWC’s more progressive pricing: at 40 ccf/month a SJWC customer pays $52.09 more than a SJ Muni customer. That means SJWC likely gets significantly more of its revenue from the high-volume customers who pay high prices for water.
Conservation
Is water consumption in San Jose consistent with those differences in pricing? This chart shows SJ Muni’s water conservation from 2015-2018, and population-weighted conservation for SJWC and Great Oaks for the same period, compared with the same month in 2013:
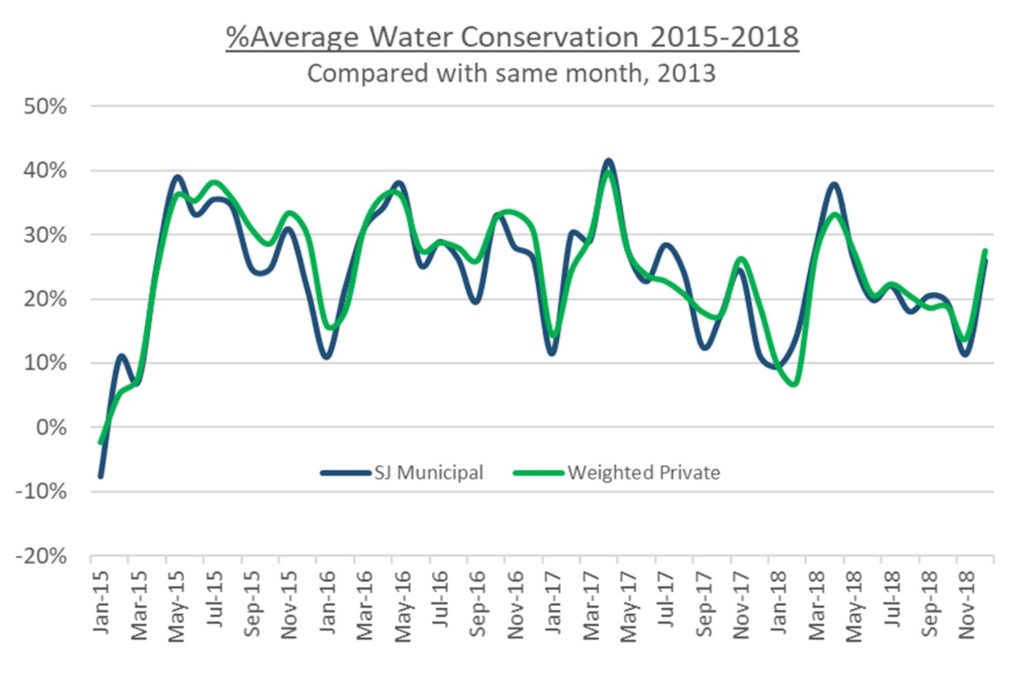
Notice how the green (private) line is close to but usually slightly above the blue (SJ municipal) line? Overall conservation tracks pretty closely for public vs. private over the four-year period, but San Jose’s private systems have averaged about 1% more savings.
The difference in per capita water use is much more noticeable; here’s residential gallons per capita per day in 2018:

San Jose’s private utility customers are much more conservative with water than are SJ Muni’s customers, using about eight gallons per person less water on average. The disparity is greatest during the seasonal peak period when supply stresses are also greatest.
Decoupling to the (utility’s) rescue!
In 2018, SJWC’s water customers were so conservative that the utility had a $9 million shortfall in sales revenue. California’s policy of rate decoupling allows the company to make up that shortfall with a rate increase in 2019. San Jose residents and lawmakers are angry that their reward for conservation success is a rate hike. Flat rates help keep SJ Muni’s revenues steadier and so spare the city council from the citizen wrath that such a rate increase might unleash.
Lots of things cause people to use more or less water, and so we can’t say for certain that prices drove the conservation patterns we see in San Jose without detailed customer-level data and a carefully-designed study. But it’s fair to say that San Jose’s experience is consistent with the public-private differences we see in the rest of California. Without decoupling, it’s unlikely that private utilities would use progressive pricing and risk the kinds of revenue losses that they experienced in 2018.
Economics is supposed to be the dismal science and politics the art of the possible. But for California water, the opposite seems to hold: decoupling makes conservation economically viable for private firms, while politics forces governments into difficult choices that can mean financial success at an environmental cost.
*The full study is available from Policy Studies Journal.
† SJ Muni’s flat water rates vary by geographic zone. The graph here uses a simple average of those rates.